Configure SSM Run Command and PutMetricData API to deliver custom metrics periodically
We will introduce a configuration that uses SSM Run Command to deliver custom metrics to CloudWatch on a regular basis.
There are two ways to push custom metrics to CloudWatch.
you can push custom metrics to CloudWatch using the unified CloudWatch agent or the API.
How can I push custom metrics to CloudWatch?
This time, we will use the SSM Run Command to call the PutMetricData API periodically (every 30 minutes) to deliver custom metrics.
For more information on installing CloudWatch Agent and delivering metrics, please refer to the following page.
Environment
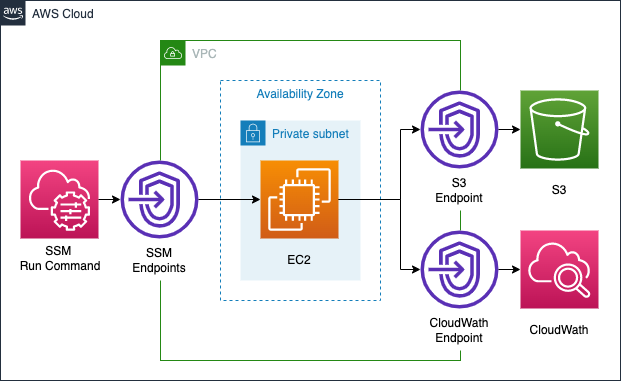
In this configuration, VPC endpoints will be set up to access the following three types of services from within the private subnet.
- SSM: To periodically run the PutMetricData API on instances with Run Command
- S3: To store the results of Run Command execution in an S3 bucket
- CloudWatch: To deliver custom metrics via PutMetricData API
The custom metrics to be configured this time will be as described in How can I push custom metrics to CloudWatch?. Specifically, the number of connections on a specific port is counted and delivered as custom metrics.
CloudFormation template files
We will build the above configuration using CloudFormation.
We have placed the CloudFormation template at the following URL.
https://github.com/awstut-an-r/awstut-dva/tree/main/02/001
Explanation of key points of template files
We will cover the key points of each template file to configure this environment.
Grant permissions to access SSM, S3, and CloudWatch with IAM role
The point is the IAM role that is attached to the instance.
Resources:
  InstanceRole:
    Type: AWS::IAM::Role
    Properties:
      AssumeRolePolicyDocument:
        Version: 2012-10-17
        Statement:
          - Effect: Allow
            Action: sts:AssumeRole
            Principal:
              Service:
                - ec2.amazonaws.com
      Policies:
        - PolicyName: PermitPutMetricData
          PolicyDocument:
            Version: 2012-10-17
            Statement:
              - Effect: Allow
                Action:
                  - cloudwatch:PutMetricData
                Resource: "*"
        - PolicyName: DeliverLogPolicy
          PolicyDocument:
            Version: 2012-10-17
            Statement:
              - Effect: Allow
                Action:
                  - s3:GetObject
                  - s3:PutObject
                  - s3:PutObjectAcl
                  - s3:ListBucket
                Resource:
                  - !Sub "arn:aws:s3:::${SSMLogBucket}"
                  - !Sub "arn:aws:s3:::${SSMLogBucket}/*"
      ManagedPolicyArns:
        - arn:aws:iam::aws:policy/AmazonSSMManagedInstanceCore
Code language: YAML (yaml)
In this configuration, we will create an IAM role to grant the permissions required to work with the three services: SSM will be covered by the AWS managed policy AmazonSSMManagedInstanceCore, and CloudWatch and S3 will be covered by inline policies.
Periodically call PutMetricData API in SSM Run Command to deliver to custom metrics
Check SSM associations.
Resources:
  RunShellScriptAssociation:
    Type: AWS::SSM::Association
    Properties:
      AssociationName: !Sub ${Prefix}-run-shellscript-association
      Name: AWS-RunShellScript
      OutputLocation:
        S3Location:
          OutputS3BucketName: !Ref SSMLogBucket
          OutputS3KeyPrefix: shellscript-association-log
      Parameters:
        commands:
          - "port=443"
          - "total_conn=$(netstat -an | grep $port | wc -l)"
          - "instance_id=$(ec2-metadata -i | cut -d ' ' -f 2)"
          - "aws cloudwatch put-metric-data --namespace 'totalconn' --metric-name $port --dimensions Instance=$instance_id --value $total_conn --region ap-northeast-1"
          - "echo `date` instance_id=$instance_id, port=$port, total_conn=$total_conn"
      ScheduleExpression: cron(0/30 * * * ? *)
      #ScheduleExpression: rate(30 minutes)
      Targets:
        - Key: InstanceIds
          Values:
            - !Ref Instance
      WaitForSuccessTimeoutSeconds: !Ref WaitForSuccessTimeoutSeconds
Code language: YAML (yaml)
The execution of the SSM Run Command can be achieved by defining an AWS::SSM::Association resource.
This time, the PutMetricData API call will be executed from the AWS CLI, and we will define the process to be executed periodically as a shell script in order to deliver to custom metrics from the AWS CLI. The SSM document that should be executed to run the shell script is AWS-RunShellScript. define the necessary commands in the commands property in the Parameters property. The commands are defined in the commands property of the Parameters property, see How can I push custom metrics to CloudWatch? for the commands. The last echo command is the execution log to be output to the S3 bucket.
Periodic execution of SSM Run Command can be configured with ScheduleExpression property. The notation is detailed in Cron and rate expressions for associations, but you can specify the timing of execution in either cron or rate format.
There is a caveat to periodic execution in the SSM Run Command, which is the restriction on the minimum execution interval.
Associations support the following cron expressions: every 1/2, 1, 2, 4, 8, or 12 hours; every day or every week at a specific time.
Associations support the following rate expressions: intervals of 30 minutes or greater and less than 31 days.
Cron and rate expressions for associations
This means that the shortest interval is every 30 minutes. Therefore, we will set it to run every 30 minutes again.
VPC endpoints for SSM, S3, and CloudWatch
3Create a VPC endpoint for the service. In this configuration, the instances are located in a private subnet and will be used as a route to access resources outside the VPC.
The following is the relationship between the access destination and the service name.
- S3: s3
- SSM: ssm, ec2messages, ssmmessages
- CloudWatch: monitoring
Create endpoints for SSM and CloudWatch as interface type and for S3 as gateway type.
Architecting
We will use CloudFormation to build this environment and check its actual behavior.
Create CloudFormation stacks and check resources in stacks
Create a CloudFormation stacks.
For more information on how to create stacks and check each stack, please refer to the following page.
After checking the resources for each stack, the information for the main resource created this time is as follows
- ID of the instance: i-080d5cb0109464241
- Name of the S3 bucket: dva-02-001
- Namespace for custom metrics: totalconn
Checking execution status of SSM Run Command
Check the configuration status from the AWS Management Console.
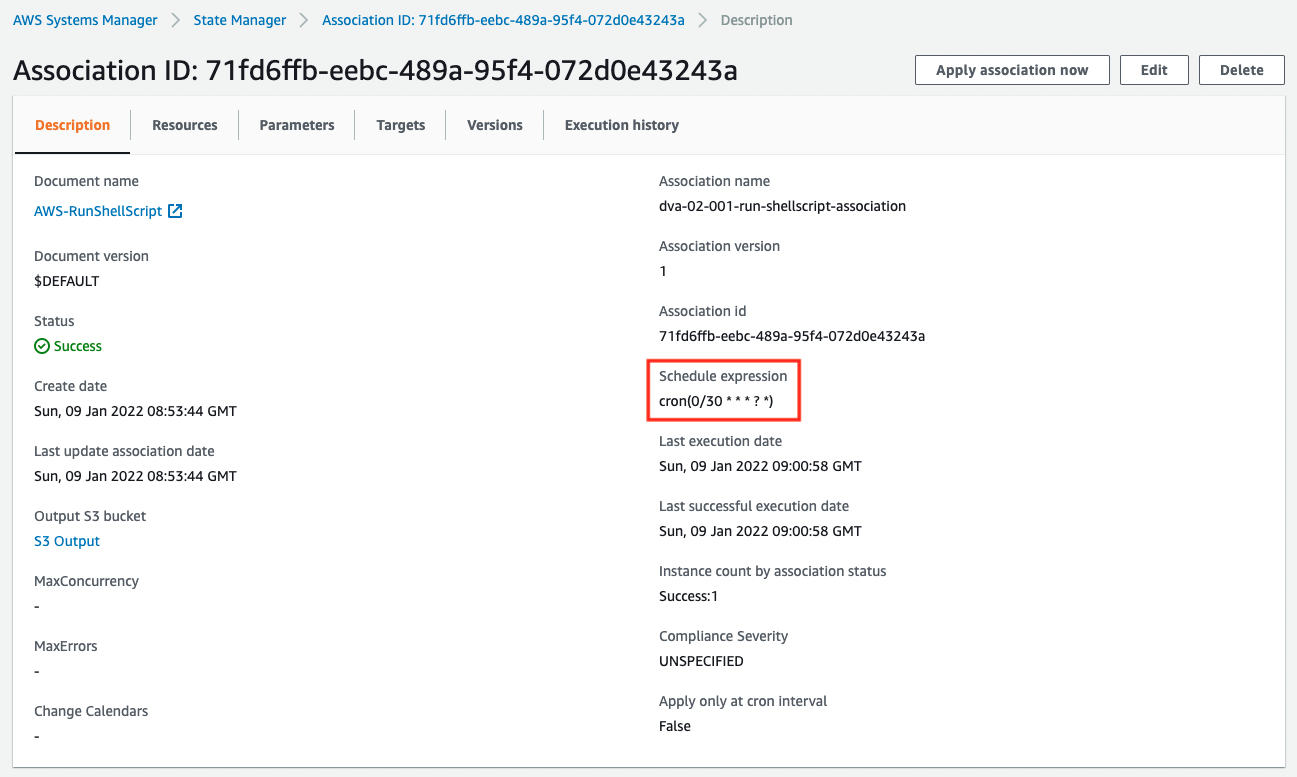
In the “Schedule expression” section, there is a statement that it will be executed every 30 minutes (0 and 30 minutes every hour).
Next, check the SSM Run Command that was executed.
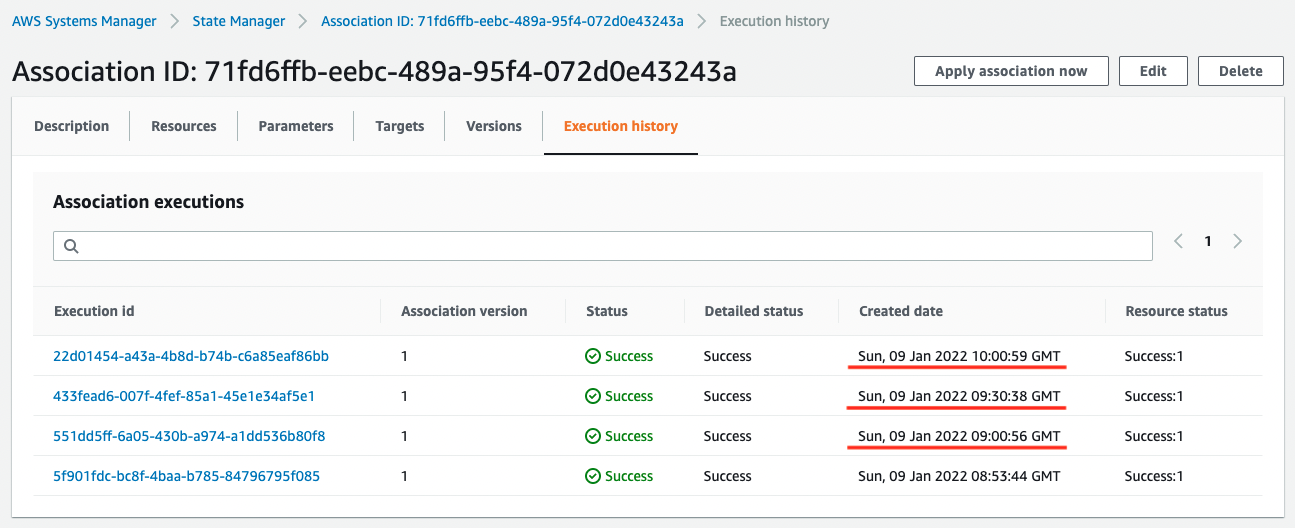
As you can see, the time is halfway only the first time, but from the second time on, it is executed at the scheduled timing.
Access the S3 bucket and check the execution log of SSM Run Command.
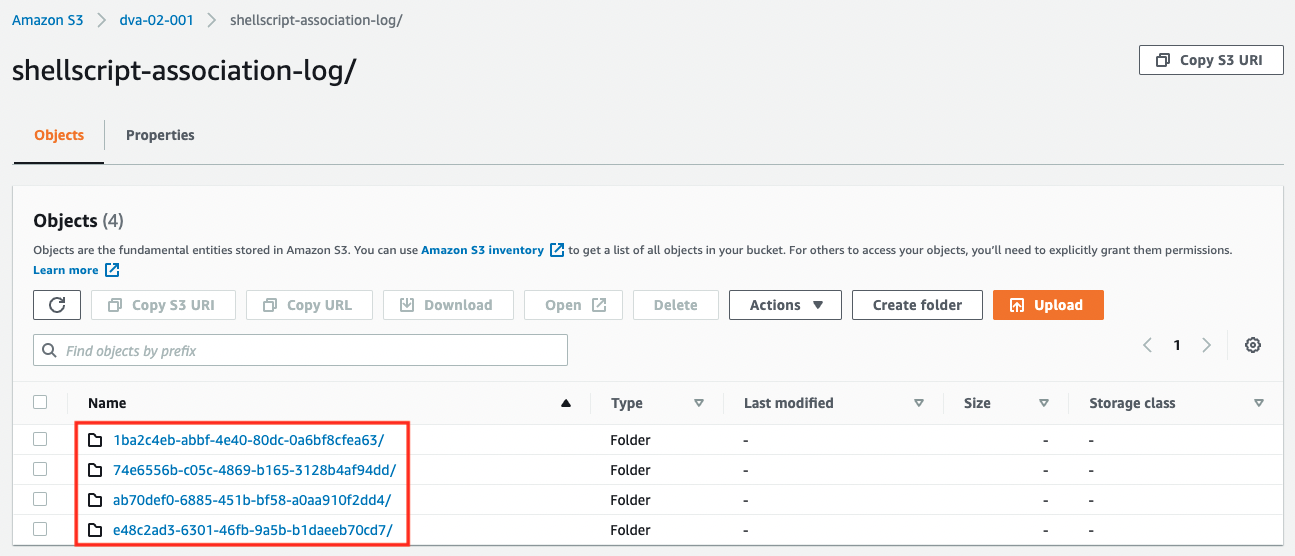
You can see that a folder is created for each Run Command execution.
Each folder contains the results of the shell script execution (stdout.txt).
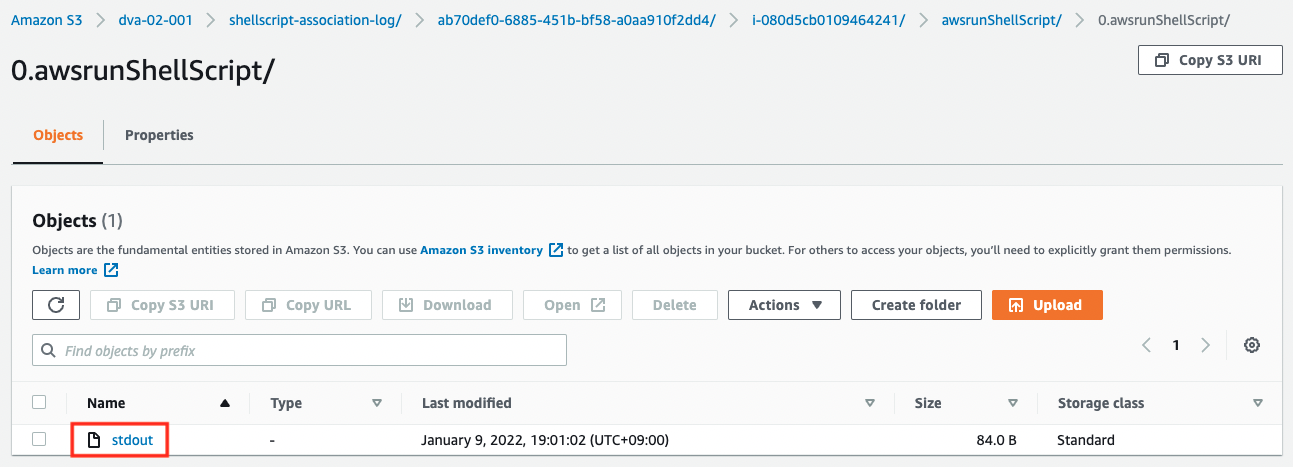
You can see that the contents of the echo command described above are output.
Sun Jan 9 10:01:01 UTC 2022 instance_id=i-080d5cb0109464241, port=443, total_conn=2
Code language: plaintext (plaintext)
Check delivery status of custom metrics
Finally, we will check the metrics.
In the AWS Management Console, access the following
CloudWatch > Metrics > All metrics > totalconn
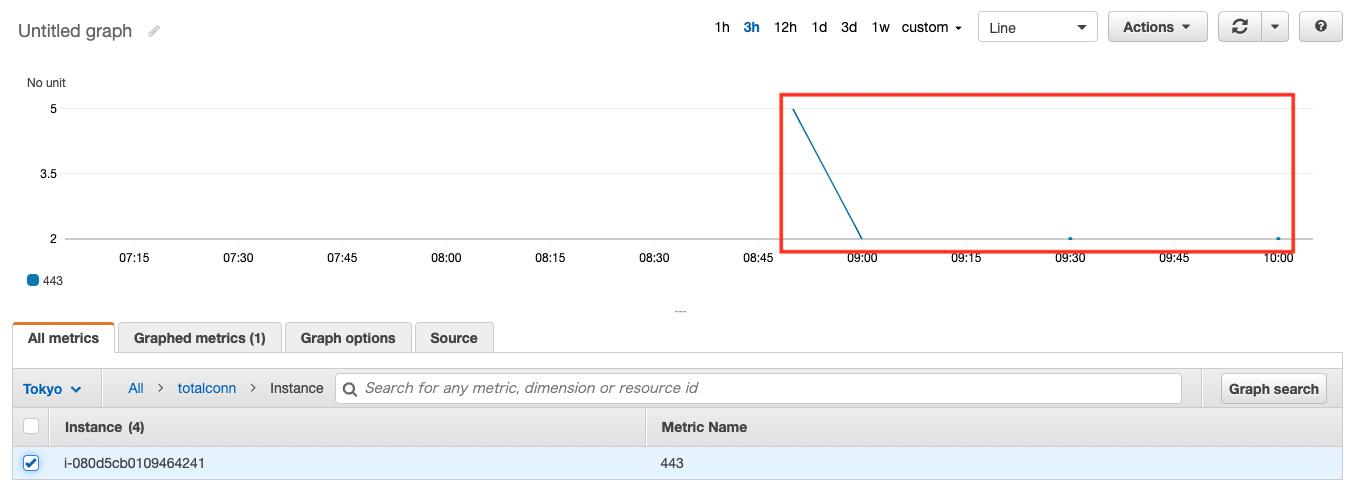
As shown above, the metrics have been delivered and the graph has been created.
Summary
Using SSM Run Command, we were able to call the PutMetricData API periodically (30 minutes/time) to deliver custom metrics.