CloudWatch metrics streams to deliver metrics to S3 buckets
This page deals with CloudWatch metrics streams.
You can use metric streams to continually stream CloudWatch metrics to a destination of your choice, with near-real-time delivery and low latency. Supported destinations include AWS destinations such as Amazon Simple Storage Service and several third-party service provider destinations.
Use metric streams
Find out how to deliver CloudWatch metric values to S3 buckets.
Environment
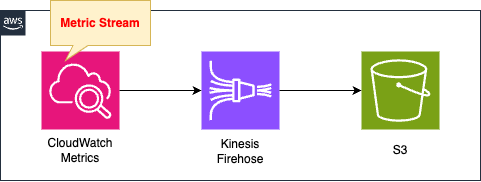
Use a metrics stream in CloudWatch.
In this case, the CPU usage of an EC2 instance is the target of the metrics stream.
The metrics stream is sent to Kinesis Data Firehose.
The destination for Kinesis Firehose is an S3 bucket.
This bucket stores the metrics data delivered from CloudWatch metrics in JSON format.
CloudFormation template files
The above configuration is built with CloudFormation.
The CloudFormation template file is located at the following URL

Explanation of key points of template files
CloudWatch Metrics Stream
Resources:
  MetricStream:
    Type: AWS::CloudWatch::MetricStream
    Properties:
      FirehoseArn: !Ref KinesisFirehoseDeliveryStreamArn
      IncludeFilters:
        - MetricNames:
            - !Ref MetricName1
          Namespace: !Ref Namespace1
      Name: !Sub "${Prefix}-ec2-cpu"
      OutputFormat: json
      RoleArn: !GetAtt MetricStreamRole.Arn
      StatisticsConfigurations:
        - AdditionalStatistics:
            - !Ref AdditionalStatistic1
          IncludeMetrics:
            - MetricName: !Ref MetricName1
              Namespace: !Ref Namespace1
Code language: YAML (yaml)
The FirehoseArn property specifies the ARN of the Kinesis Data Firehose.
This Firehose will be the destination for metrics.
The ExcludeFilters and IncludeFilters properties allow you to limit the metrics you get.
The former allows you to specify metrics you do not need, while the latter allows you to specify metrics you do need.
In this case, we will use only the latter and set it to retrieve only the EC2 CPU usage data.
In concrete terms, specify “CPUUtilization” for MetricNames and “AWS/EC2” for Namespace.
The OutputFormat property allows you to set the data delivery format.
Supported formats are listed below, but in this case we will specify “JSON”.
JSON, OpenTelemetry 1.0.0, and OpenTelemetry 0.7.0 formats are supported natively
Use metric streams
Additional statistics can be obtained by setting the StatisticsConfigurations property.
By default, the following statistics are available.
Metric streams always include the Minimum, Maximum, SampleCount, and Sum statistics.
Use metric streams
If you need other statistics than this, you will need to add them manually.
Statistics that can be added are summarized on the following page.
In this case, we will set it to retrieve the 95th percentile value of the EC2 CPU usage.
In the AdditionalStatistics property, specify “p95”, the statistics to be added.
IncludeMetrics property specifies “CPUUtilization” and “AWS/EC2” as the metric information for which to calculate additional statistics.
The RoleArn property specifies the following IAM roles.
Resources:
  MetricStreamRole:
    Type: AWS::IAM::Role
    DeletionPolicy: Delete
    Properties:
      AssumeRolePolicyDocument:
        Version: 2012-10-17
        Statement:
          - Effect: Allow
            Action: sts:AssumeRole
            Principal:
              Service:
                - streams.metrics.cloudwatch.amazonaws.com
      Policies:
        - PolicyName: MetricStreamPolicy
          PolicyDocument:
            Version: 2012-10-17
            Statement:
              - Effect: Allow
                Action:
                  - firehose:PutRecord
                  - firehose:PutRecordBatch
                Resource:
                  - !Ref KinesisFirehoseDeliveryStreamArn
Code language: YAML (yaml)
Metrics Streams grant the necessary permissions to deliver data to the Kinesis Data Firehose.
The following page was used as a reference to set up this page.
(Reference) Kinessi data fire hose
Resources:
  KinesisFirehoseDeliveryStream:
    Type: AWS::KinesisFirehose::DeliveryStream
    Properties:
      DeliveryStreamName: !Sub "${Prefix}-FirehoseDeliveryStream"
      DeliveryStreamType: DirectPut
      S3DestinationConfiguration:
        BucketARN: !Ref BucketArn
        CloudWatchLoggingOptions:
          Enabled: true
          LogGroupName: !Ref LogGroup
          LogStreamName: !Ref LogStream
        CompressionFormat: UNCOMPRESSED
        Prefix: firehose/
        RoleARN: !GetAtt KinesisS3DestinationRole.Arn
Code language: YAML (yaml)
For more information on the basics of Kinesis Data Firehose, please see the following pages.
The key to Kinesis Data Firehose receiving data sent from a metrics stream is the DeliveryStreamType property.
Specify “DirectPut” for this property.
The destination S3 bucket is specified with the S3DestinationConfiguration property.
Specify the following IAM roles in the RoleARN property.
Resources:
  KinesisS3DestinationRole:
    Type: AWS::IAM::Role
    DeletionPolicy: Delete
    Properties:
      AssumeRolePolicyDocument:
        Version: 2012-10-17
        Statement:
          - Effect: Allow
            Action: sts:AssumeRole
            Principal:
              Service:
                - firehose.amazonaws.com
      Policies:
        - PolicyName: KinesisS3DestinationPolicy
          PolicyDocument:
            Version: 2012-10-17
            Statement:
              - Effect: Allow
                Action:
                  - s3:AbortMultipartUpload
                  - s3:GetBucketLocation
                  - s3:GetObject
                  - s3:ListBucket
                  - s3:ListBucketMultipartUploads
                  - s3:PutObject
                Resource:
                  - !Ref BucketArn
                  - !Sub "${BucketArn}/*"
              - Effect: Allow
                Action:
                  - logs:PutLogEvents
                Resource:
                  - !GetAtt LogGroup.Arn
Code language: YAML (yaml)
Grant the necessary permissions to distribute metrics data to S3 buckets.
(Reference) S3 bucket
Resources:
  Bucket:
    Type: AWS::S3::Bucket
    Properties:
      AccessControl: Private
      BucketName: !Ref Prefix
Code language: YAML (yaml)
No special settings need to be made.
Architecting
Use CloudFormation to build this environment and check its actual behavior.
Create CloudFormation stacks and check the resources in the stacks
Create CloudFormation stacks.
For information on how to create stacks and check each stack, please see the following page.
Check each resource from the AWS Management Console.
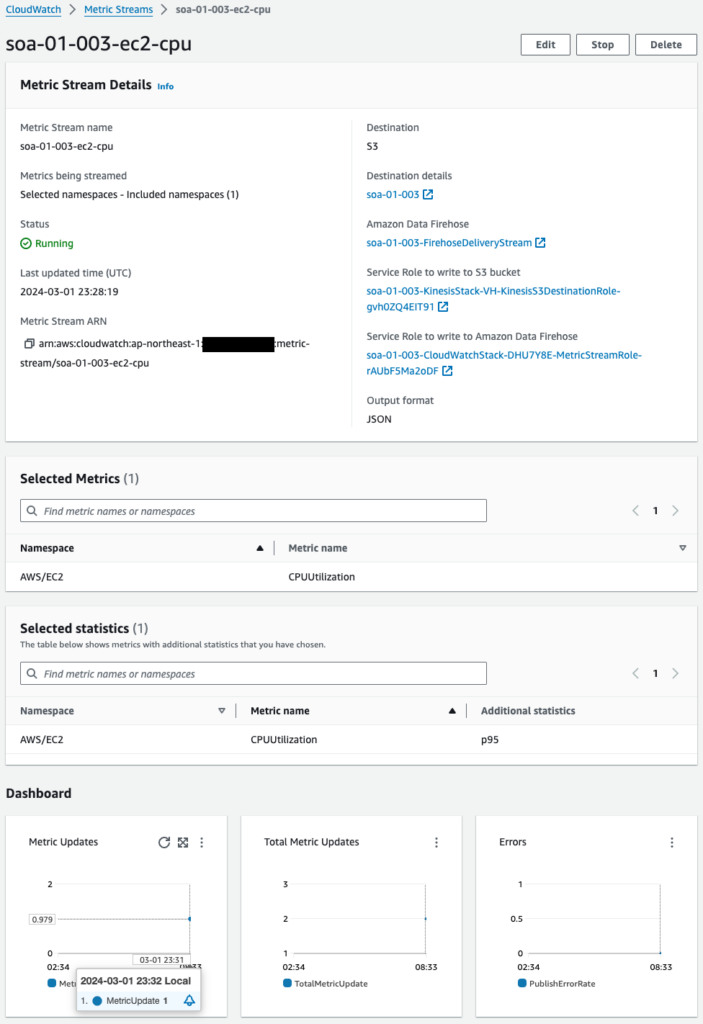
Check the CloudWatch metrics stream.
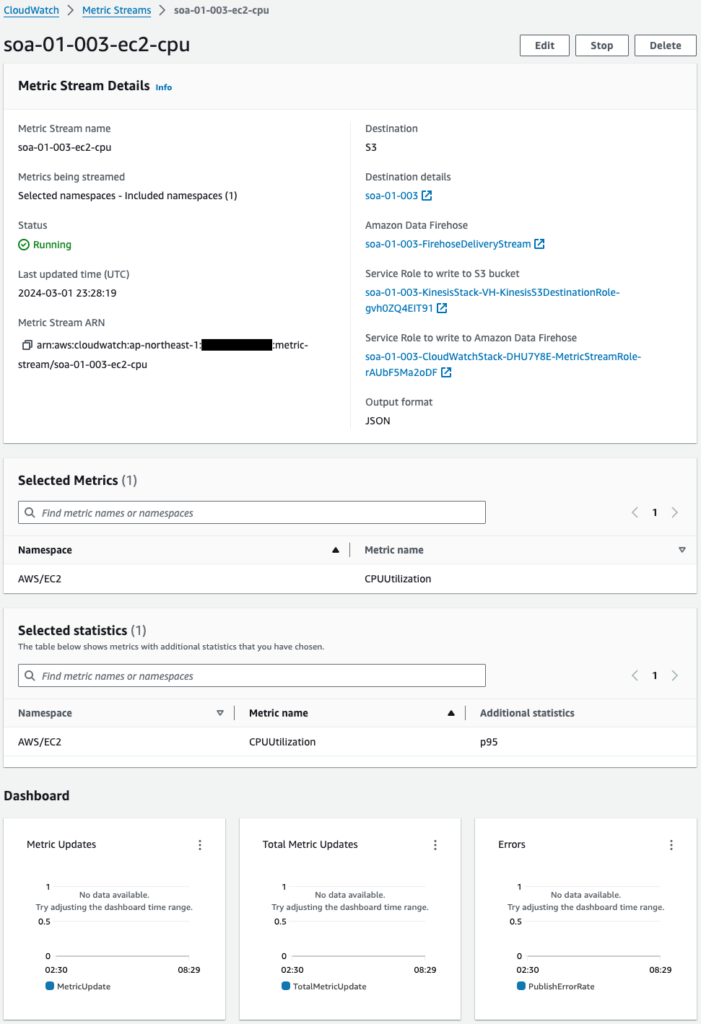
A CloudWatch metrics stream has been successfully created.
You can see that this metrics stream is destined for Kinesis Data Firehose.
You can also see from the Dashboard at the bottom that no metrics have been delivered yet.
Check Kinesis Data Firehose.
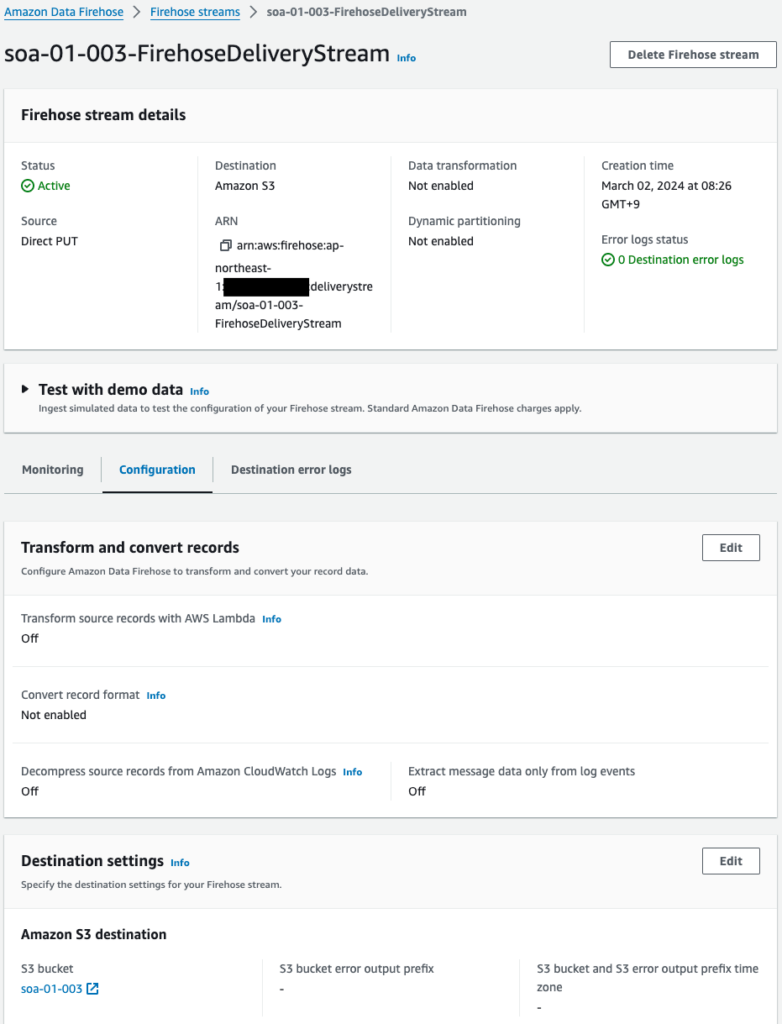
The Kinesis Data Firehose has been successfully created.
This one confirms that the destination is the S3 bucket (soa-01-003).
Check the S3 bucket.
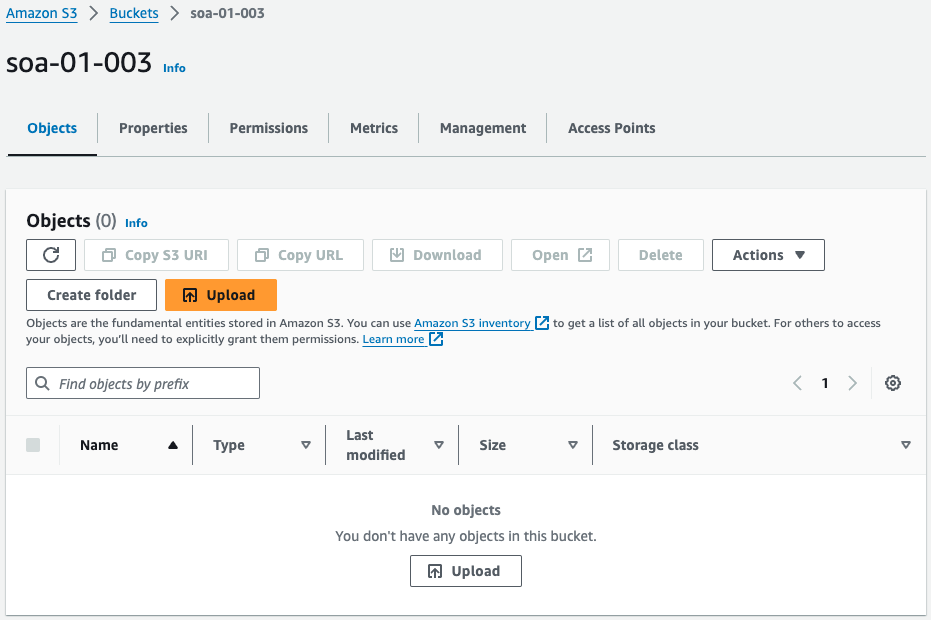
The S3 bucket has been successfully created.
The bucket is empty because no metrics have been delivered yet.
Operation Check
We are ready and will wait for a while.
After a few minutes, delivery from the CloudWatch metrics stream will begin.
The Dashboard shows that metrics distribution has started.
Next, check the Kinesis Data Firehose.
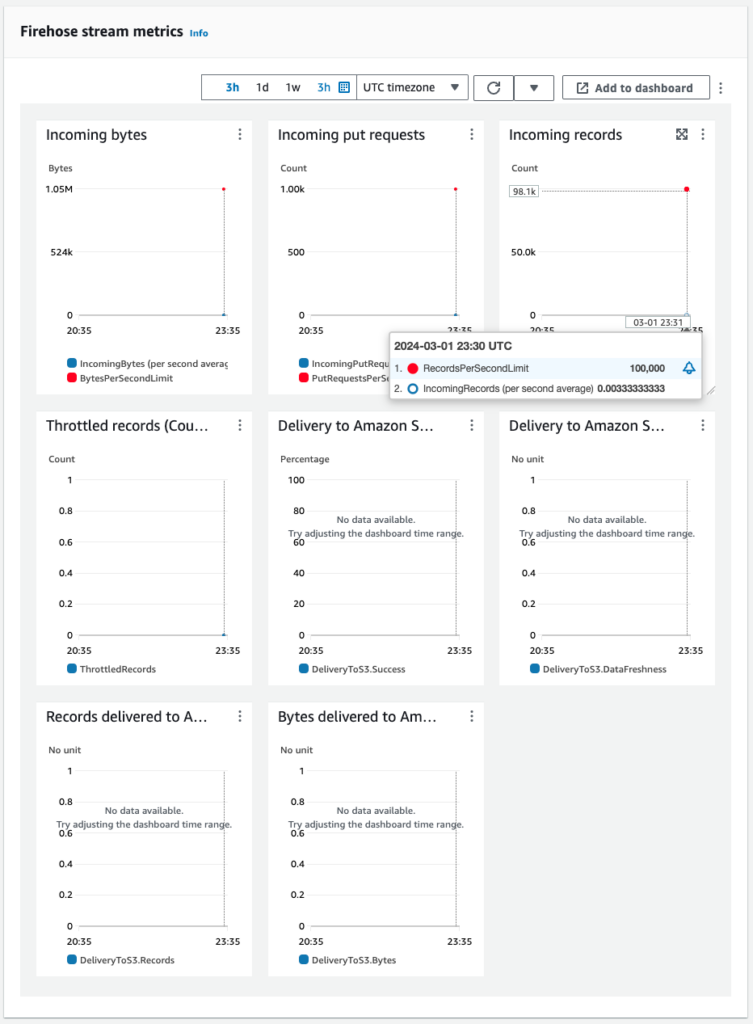
Kinesis Data Firehose monitoring shows that data is indeed being delivered.
This means that the metrics data delivered from the CloudWatch metrics stream is reaching the Kinesis Data Firehose.
Finally, check the S3 bucket.
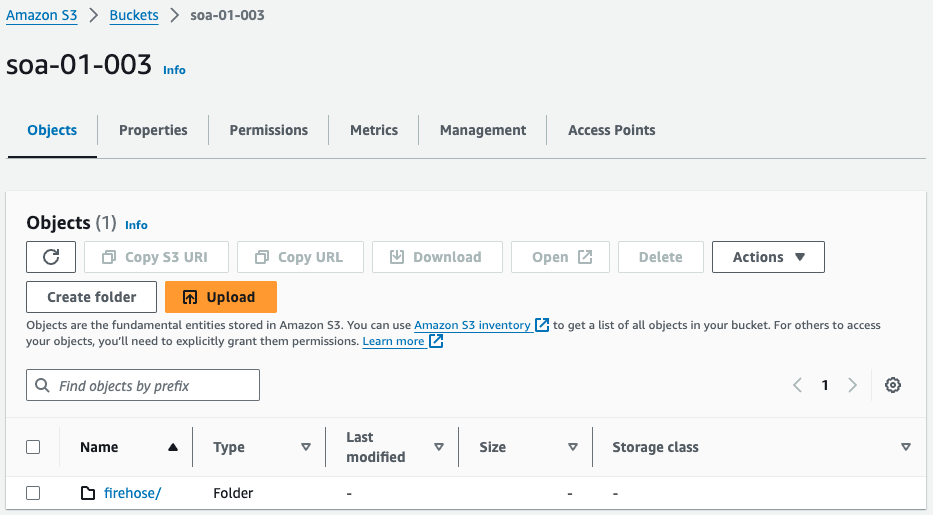
The folder has been created in the S3 bucket.
Check the contents of this folder.
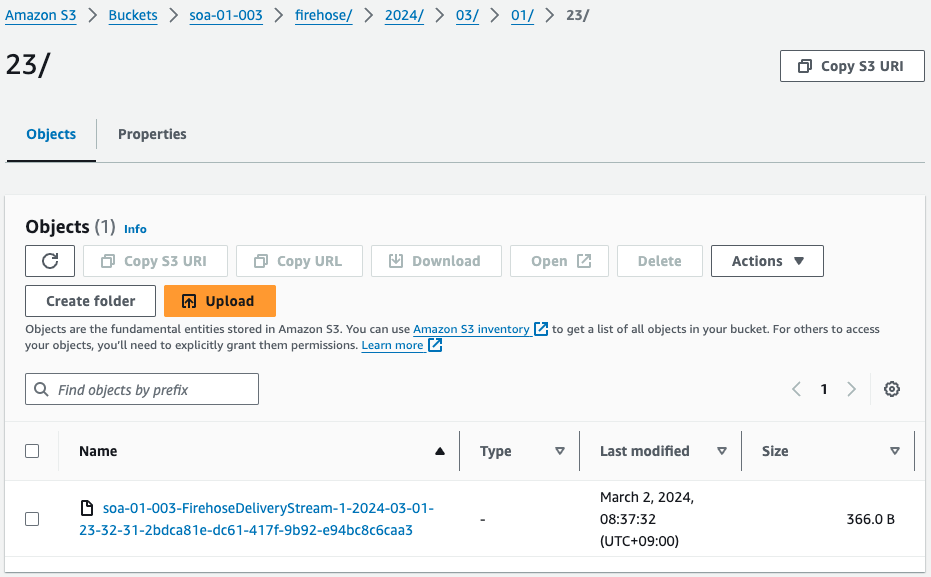
The text file is located.
This also means that the metrics data delivered from the CloudWatch metrics stream has been stored in an S3 bucket via Kinesis Data Firehose.
Finally, check the contents of the saved text file.
{
  "metric_stream_name": "soa-01-003-ec2-cpu",
  "account_id": "405418103230",
  "region": "ap-northeast-1",
  "namespace": "AWS/EC2",
  "metric_name": "CPUUtilization",
  "dimensions": {
    "InstanceId": "i-0548ccea730f12250"
  },
  "timestamp": 1709335800000,
  "value": {
    "max": 1.1247750449910017,
    "min": 1.0252392224852467,
    "sum": 2.1500142674762484,
    "count": 2,
    "p95": 1.1222726353249328
  },
  "unit": "Percent"
}
Code language: JSON / JSON with Comments (json)
The content is a JSON file.
This is the format as specified when setting up the CloudWatch metrics stream.
The CPU usage of one EC2 instance (i-0548ccea730f12250) is acquired.
If we look at the data we are able to acquire, in addition to the maximum value, minimum value, etc., we are also able to acquire the p95 (95th percentile value).
This is also a statistic that was set as additional statistics when setting up the CloudWatch metrics stream.
Summary
We have identified how to use CloudWatch metrics streams to deliver CloudWatch metric values to S3 buckets.