Measure CPU idle time for Fargate container using CloudWatch Metric Math
The following page shows how to measure the CPU usage of Fargate containers and notify by email when the threshold is exceeded.
This time we will use Metric Math to generate new data from the above CPU utilization.
Metric math enables you to query multiple CloudWatch metrics and use math expressions to create new time series based on these metrics.
Using metric math
In this case, we aim to calculate CPU idle time based on CPU usage and email notifications when it falls below a threshold value.
Environment
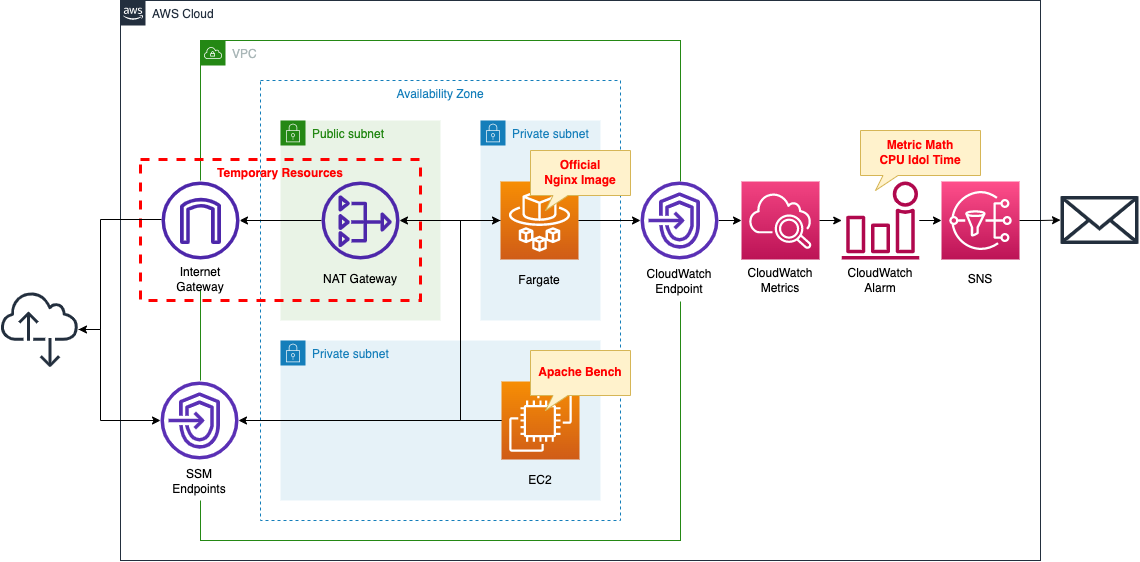
Create a Fargate type ECS on a private subnet.
Create a VPC endpoint for metrics in the container subnet to deliver metrics from the private subnet to CloudWatch.
In CloudWatch alarms, set thresholds for Fargate’s CPU idle time.
The idle time is calculated using the Metric Math formula expression.
Set a message to be published to SNS when idle time falls below 98%.
Set the SNS as a subscriber to the email address.
Create an EC2 instance.
Use it as a client to access the container.
Create a NAT gateway for two purposes.
The first is to get an official Nginx image from DockerHub in order to create an ECS container.
The second is to install Apache Bench on the EC2 instance, which will run against the ECS container and generate a large number of requests, which will increase CPU usage and raise alarms.
Once the above uses are completed, the NAT gateway is no longer needed.
In this case, we will use a CloudFormation custom resource and configure it to eventually remove the NAT gateway, etc.
CloudFormation template files
The above configuration is built using CloudFormation.
The CloudFormation template is located at the following URL
https://github.com/awstut-an-r/awstut-fa/tree/main/073
Explanation of key points of the template files
The basic configuration is the same as the page introduced at the beginning of this document.
This page focuses on the description of Metric Math.
CloudWatch Metric Math
Resources:
  Alarm:
    Type: AWS::CloudWatch::Alarm
    Properties:
      AlarmActions:
        - !Ref TopicArn
      ComparisonOperator: LessThanThreshold
      EvaluationPeriods: 1
      Metrics:
        - Expression: 100 - m1
          Id: it1
          Label: cluster_idol_time
          ReturnData: true
        - Id: m1
          Label: cluster_cpu_utilization
          MetricStat:
            Metric:
              MetricName: CPUUtilization
              Dimensions:
                - Name: ClusterName
                  Value: !Ref ClusterName
                - Name: ServiceName
                  Value: !Ref ServiceName
              Namespace: AWS/ECS
            Period: 60
            Stat: Average
            Unit: Percent
          ReturnData: false
      Threshold: 98
Code language: YAML (yaml)
Metric Math is defined as one of the CloudWatch alarm settings.
Metric Math setting in the Metrics property.
Two metrics are configured.
The first metric is the CPU idle time.
Define a formula in the Expression property.
To calculate the idle time, define it as 1 minus the CPU utilization, which is the metric described below.
For a metric that defines a formula expression, set the ReturnData property to “true”.
When you create an alarm based on a metric math expression, specify True for this value for only the one math expression that the alarm is based on. You must specify False for ReturnData for all the other metrics and expressions used in the alarm.
AWS::CloudWatch::Alarm MetricDataQuery
The second is a metric that refers to CPU usage.
The MetricStat property specifies a metric (CPUUtilization) for Fargate’s CPU utilization.
The notation is similar to that used when setting alarms for the same metric.
The ReturnData property should be set to “false”.
Architecting
Using CloudFormation, build this environment and check the actual behavior.
Create a CloudFormation stacks and check resources in stacks
Create a CloudFormation stack.
For information on how to create stacks and check each stack, please refer to the following page
After checking the resources in each stack, information on the main resources created this time is as follows
- SNS topic: fa-073
- ECS cluster: fa-073-cluster
- ECS service: fa-073-service
- EC2 instance: i-0b8bfd98d1ecb5a30
Authentication of email address
If you specify an email address as a subscriber to an SNS topic, you must authenticate that email address.
For more information, please refer to the following page
Resource Confirmation
Check each resource from the AWS Management Console.
Check the SNS topic.
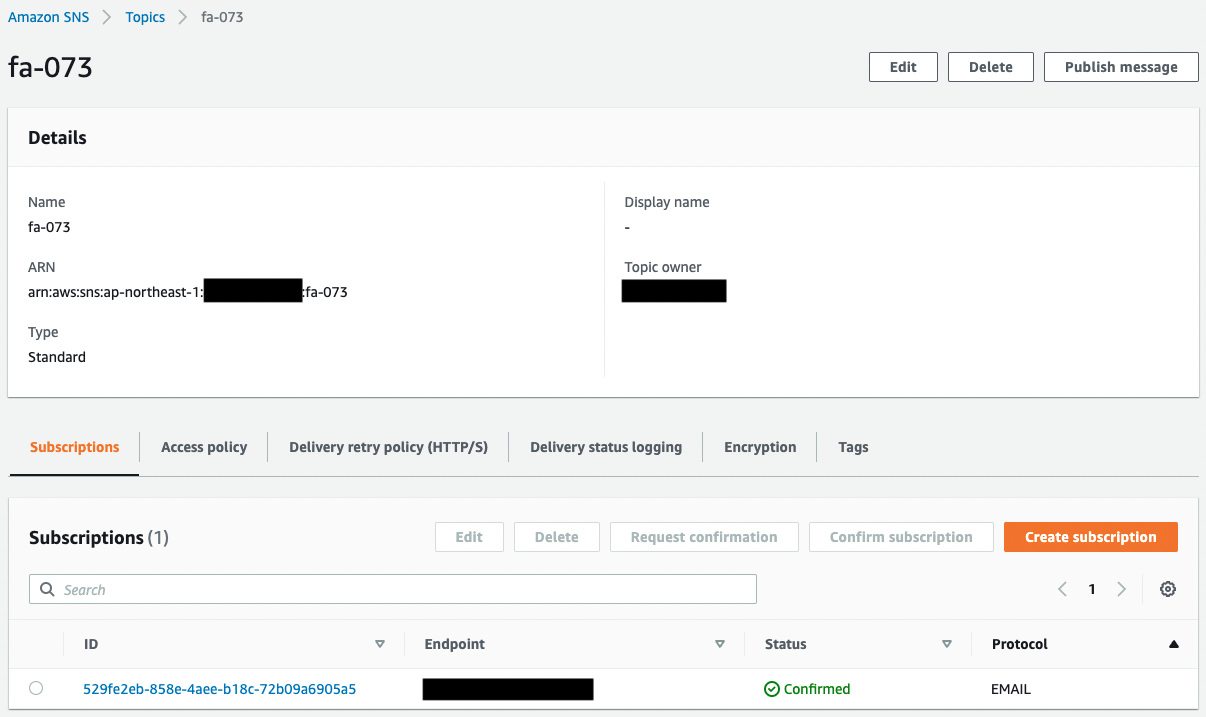
You can see that the SNS topic has been successfully created.
In addition, you can see that the email address registered as a subscriber is registered.
The Status value of the email address is “Confirmed,” indicating that the authentication has been completed.
Next, check ECS (Fargate).
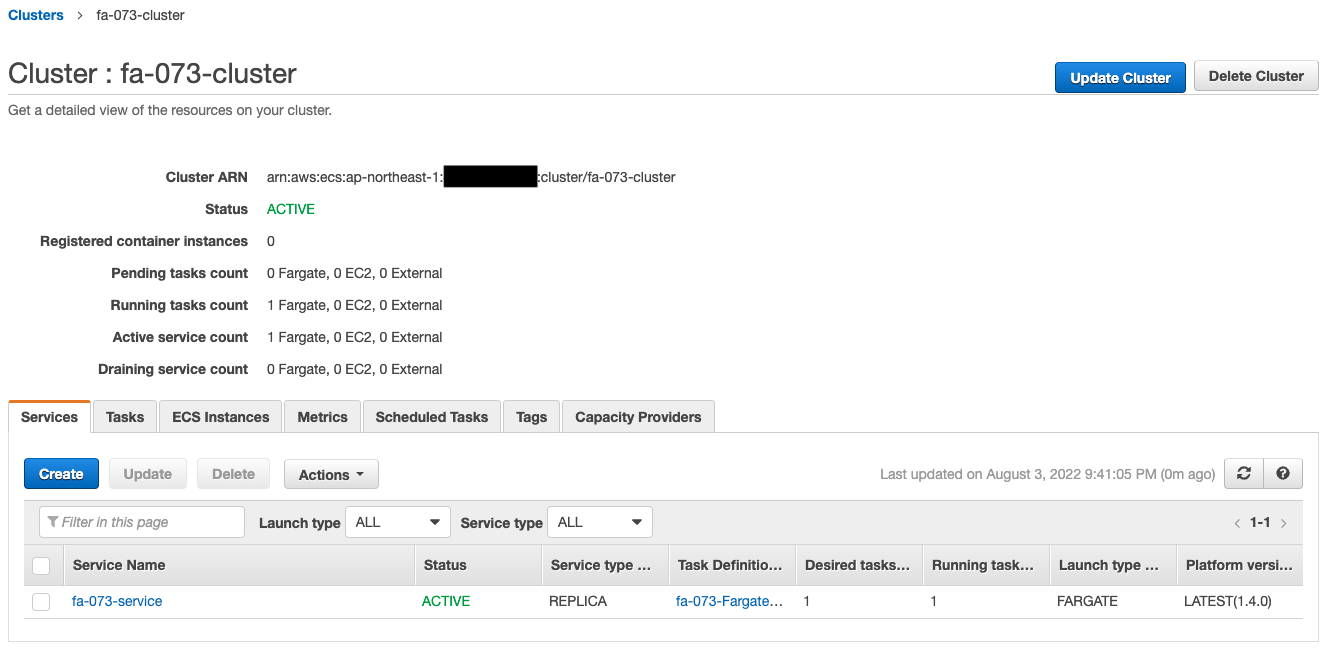
The ECS cluster service task has been successfully created.
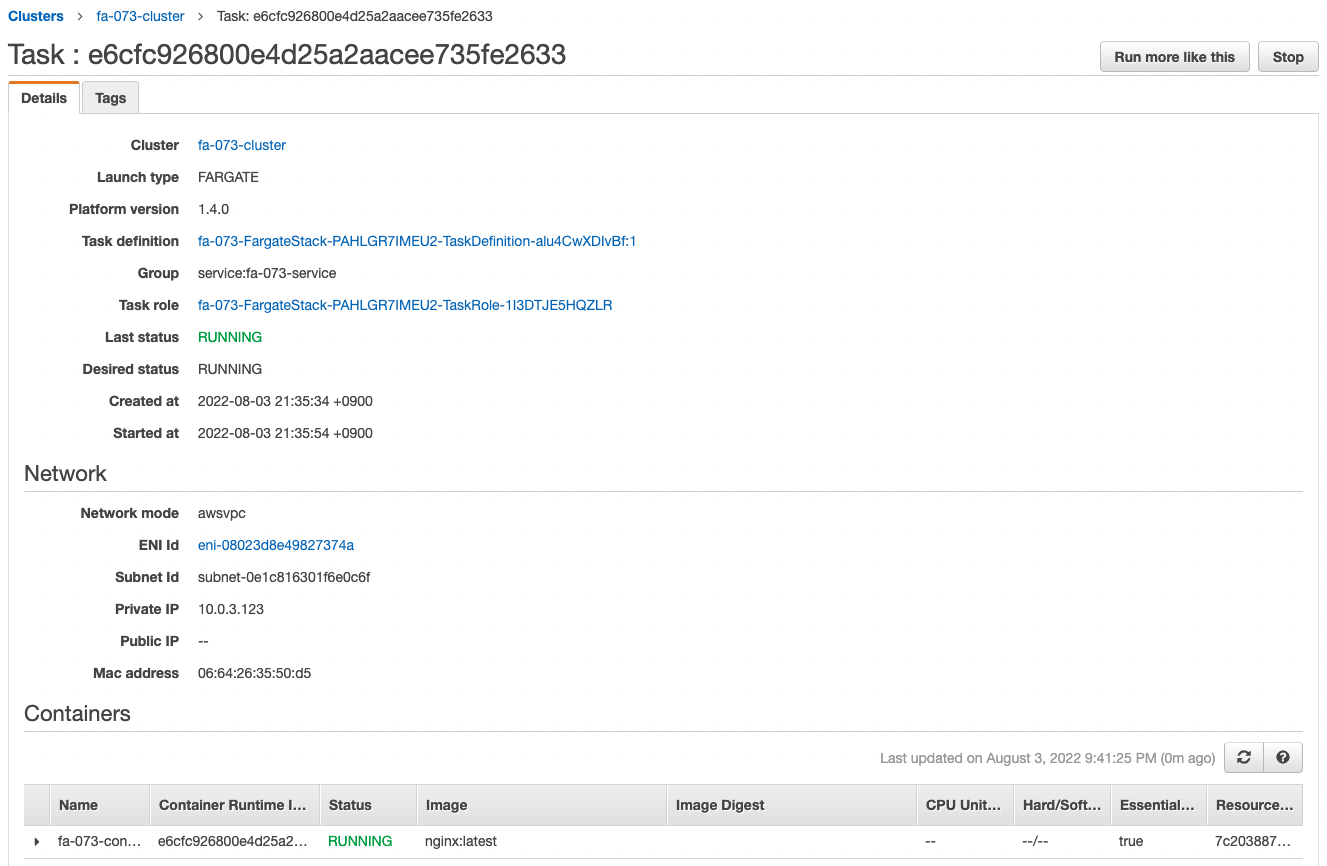
The latest version of Nginx image is obtained from Dockerhub and a container is created from it.
You can also see that the private address assigned to the task is “10.0.3.123”.
Check the CloudWatch alarm.
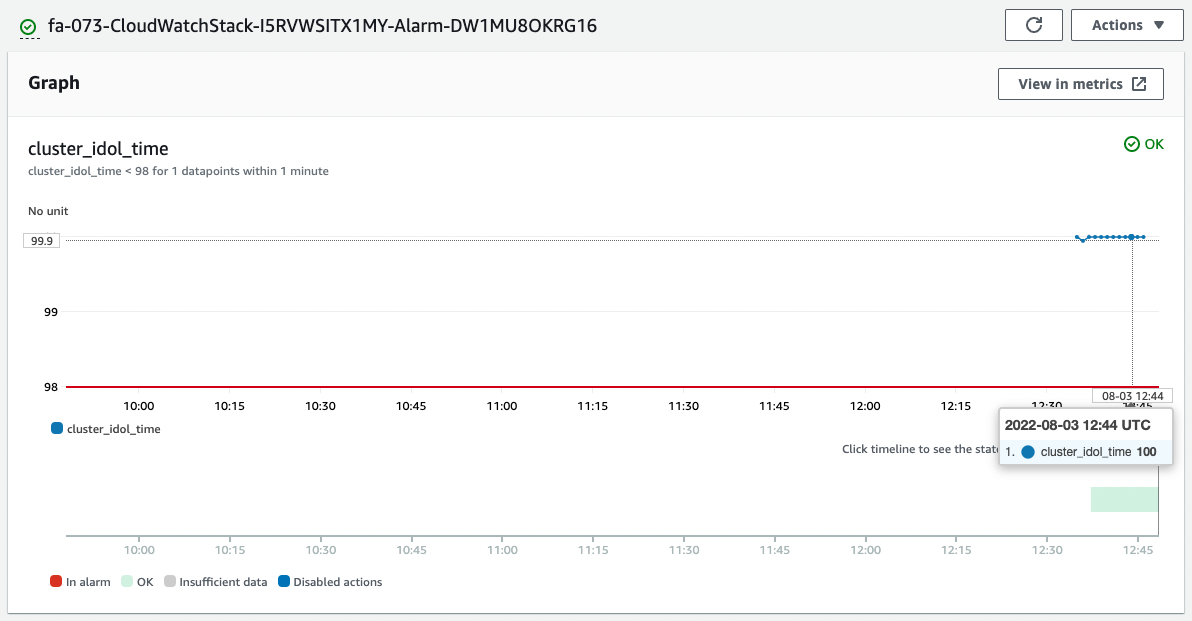
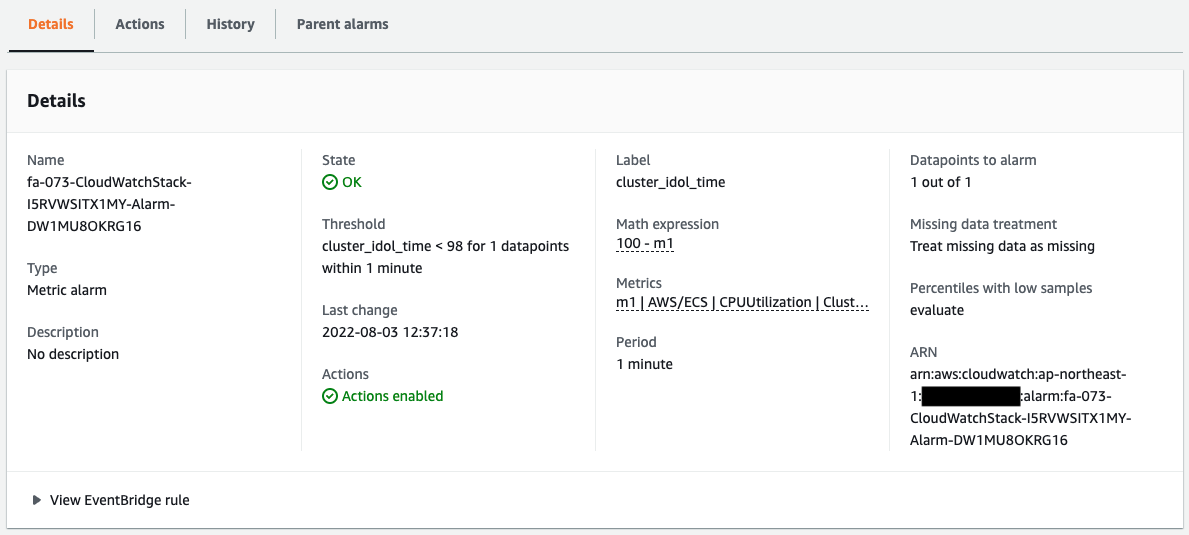
The alarm has been successfully created.
The graph shows that idle time is calculated from CPU usage.
Currently, almost 100% of the time is idle time.
Therefore, since it is above the threshold value of 98%, the status is “OK” and not in an alarm state.
By the way, the following is the original CPU utilization.
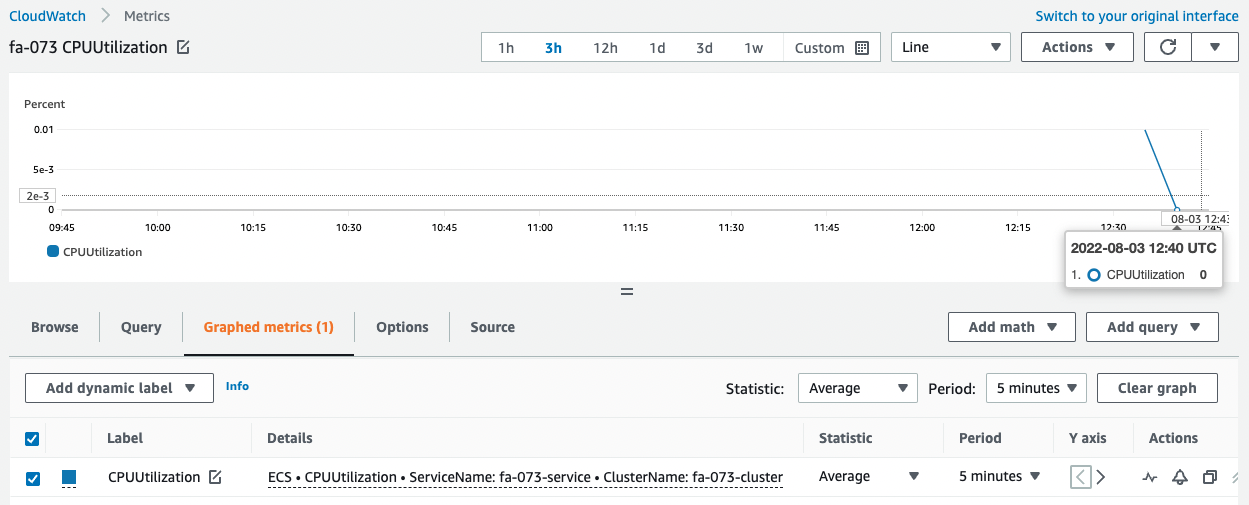
It was slightly increased immediately after startup, but after that, we can see that the utilization is 0%.
This shows that idle time is calculated accurately.
Checking Action
Now that everything is ready, access the EC2 instance.
Use SSM Session Manager to access the instance.
% aws ssm start-session --target i-0b8bfd98d1ecb5a30

Starting session with SessionId: root-0dc7b12a7aabc453b
sh-4.2$
Code language: Bash (bash)
For more information on SSM Session Manager, please refer to the following page
Access the container in the task using the curl command.
sh-4.2$ curl http://10.0.3.123
<!DOCTYPE html>
<html>
<head>
<title>Welcome to nginx!</title>
<style>
html { color-scheme: light dark; }
body { width: 35em; margin: 0 auto;
font-family: Tahoma, Verdana, Arial, sans-serif; }
</style>
</head>
<body>
<h1>Welcome to nginx!</h1>
<p>If you see this page, the nginx web server is successfully installed and
working. Further configuration is required.</p>

<p>For online documentation and support please refer to
<a href="http://nginx.org/">nginx.org</a>.<br/>
Commercial support is available at
<a href="http://nginx.com/">nginx.com</a>.</p>

<p><em>Thank you for using nginx.</em></p>
</body>
</html>
Code language: Bash (bash)
I was able to access the site successfully.
We can see that the Nginx container is in action on Fargate.
We will now increase Fargate’s CPU utilization to trigger an action on the CloudWatch alarm.
To increase CPU utilization, we will use Apache Bench to generate and load a large number of requests.
First make sure Apache is installed.
sh-4.2$ sudo yum list installed | grep httpd
generic-logos-httpd.noarch            18.0.0-4.amzn2                 @amzn2-core
httpd.aarch64                         2.4.54-1.amzn2                 @amzn2-core
httpd-filesystem.noarch               2.4.54-1.amzn2                 @amzn2-core
httpd-tools.aarch64                   2.4.54-1.amzn2                 @amzn2-core
Code language: Bash (bash)
Apache appears to have been successfully installed by the user data.
Run Apache Bench.
Generate 100,000 requests for a container (task) on Fargate.
sh-4.2$ ab -n 100000 http://10.0.3.123/
This is ApacheBench, Version 2.3 <$Revision: 1901567 $>
Copyright 1996 Adam Twiss, Zeus Technology Ltd, http://www.zeustech.net/
Licensed to The Apache Software Foundation, http://www.apache.org/

Benchmarking 10.0.3.123 (be patient)
Completed 10000 requests
Completed 20000 requests
Completed 30000 requests
Completed 40000 requests
Completed 50000 requests
Completed 60000 requests
Completed 70000 requests
Completed 80000 requests
Completed 90000 requests
Completed 100000 requests
Finished 100000 requests


Server Software:        nginx/1.23.1
Server Hostname:        10.0.3.123
Server Port:            80

Document Path:          /
Document Length:        615 bytes

Concurrency Level:      1
Time taken for tests:   35.679 seconds
Complete requests:      100000
Failed requests:        0
Total transferred:      84800000 bytes
HTML transferred:       61500000 bytes
Requests per second:    2802.78 [#/sec] (mean)
Time per request:       0.357 [ms] (mean)
Time per request:       0.357 [ms] (mean, across all concurrent requests)
Transfer rate:          2321.05 [Kbytes/sec] received

Connection Times (ms)
              min  mean[+/-sd] median   max
Connect:        0    0   0.1      0       7
Processing:     0    0   0.1      0       7
Waiting:        0    0   0.1      0       7
Total:          0    0   0.1      0       8

Percentage of the requests served within a certain time (ms)
  50%      0
  66%      0
  75%      0
  80%      0
  90%      0
  95%      1
  98%      1
  99%      1
 100%      8 (longest request)
Code language: Bash (bash)
The CPU utilization should have increased due to the load from the Apache Bench.
Check the CloudWatch alarm again.
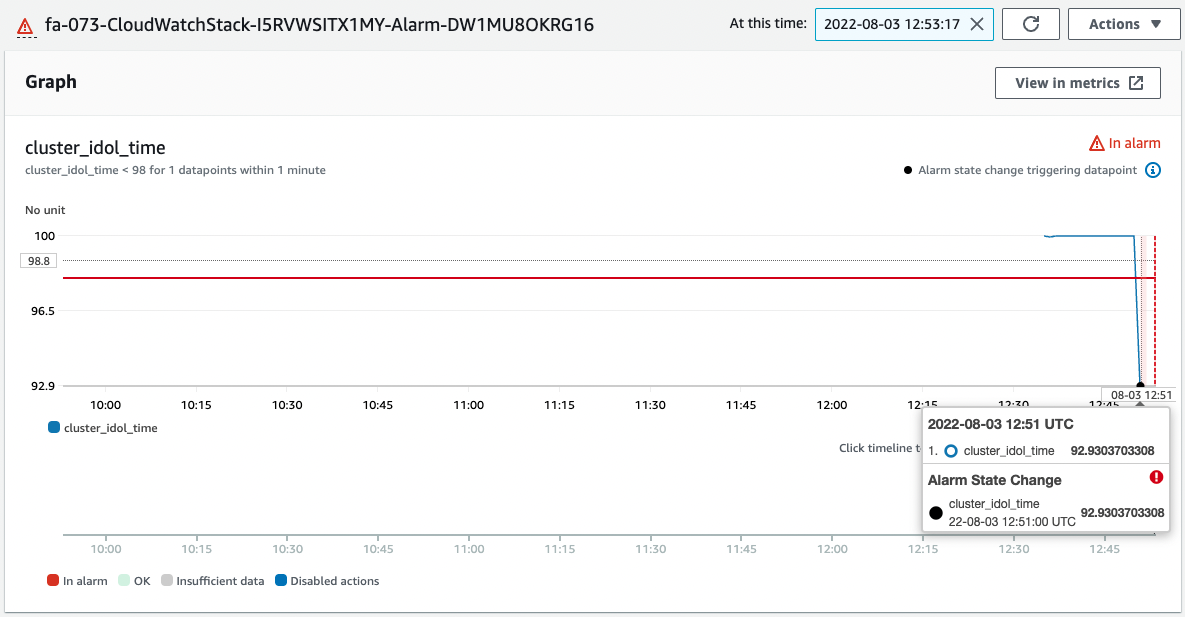
CPU idle time is below 98%.
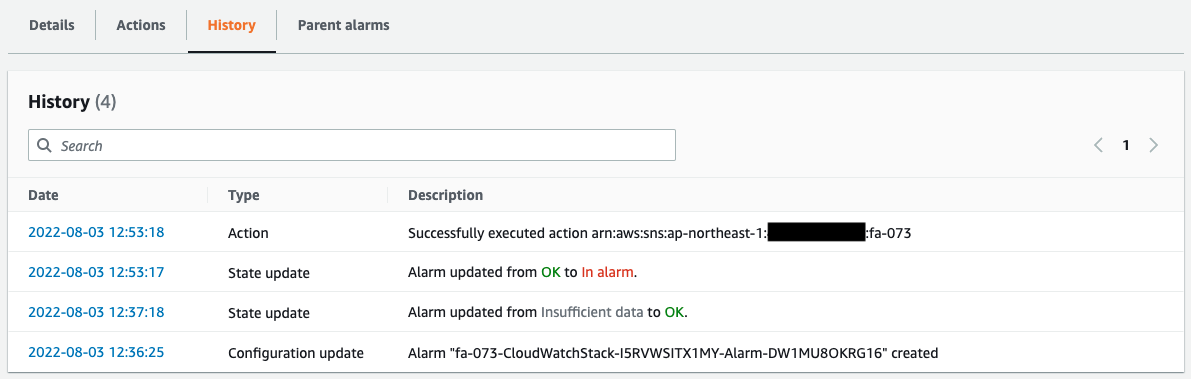
The alarm threshold has been exceeded, so the status changes from “OK” to “In alarm”.
The history shows that a message was sent to the SNS as an Action due to the alarm status.
The following email was immediately sent to the registered address.
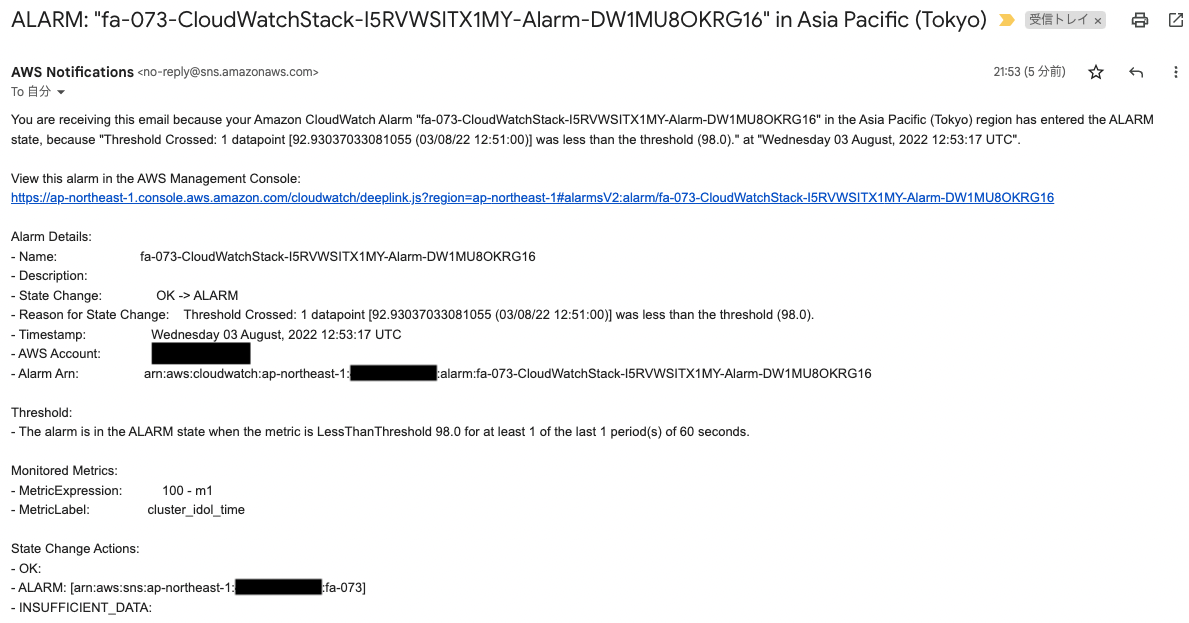
The body of the email is the contents of the CloudWatch alarm.
In this way, by using CloudWatch Metric Math, we were able to generate new data from a metric, and when the threshold value was exceeded, we were able to notify via email in conjunction with the SNS.
Conclusion
We have confirmed how to calculate CPU idle time from CPU usage and notify via email when it falls below the threshold value.