Email notification via SNS from CloudWatch Alarm when ECS (Fargate) CPU usage exceeds threshold values
When a Fargate type ECS is created, CPU and memory usage are delivered to CloudWatch metrics by default.
This time, we will use CloudWatch alarm to set a threshold for CPU usage and aim to send email notifications when the limit is exceeded.
Environment
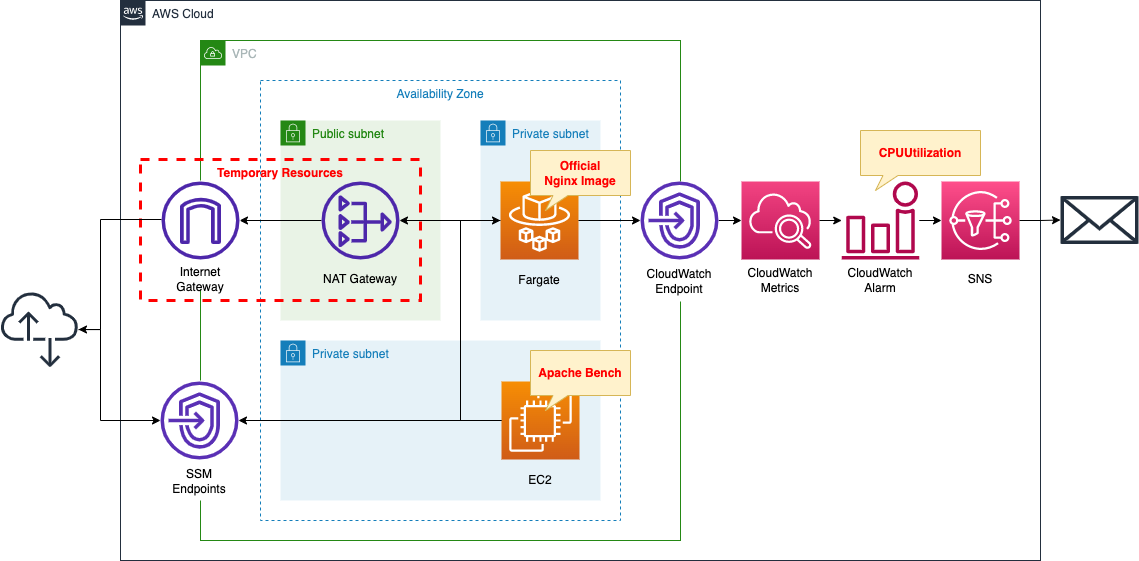
Create a Fargate type ECS on a private subnet.
Create a VPC endpoint for metrics in the container subnet to deliver metrics from the private subnet to CloudWatch.
Set thresholds for CPU utilization in CloudWatch alarm.
Configure SNS to publish a message when utilization exceeds 0.1%.
SNS sets up email addresses as subscribers.
Create an EC2 instance.
Use it as a client to access the container.
Create a NAT gateway for two purposes.
The first is to get an official Nginx image from DockerHub in order to create an ECS container.
The second is to install Apache Bench on the EC2 instance, which will run against the ECS container and generate a large number of requests, which will increase CPU usage and raise alarm.
Once the above uses are completed, the NAT gateway is no longer needed.
In this case, we will use a CloudFormation custom resource and configure it to eventually remove the NAT gateway, etc.
CloudFormation template files
The above configuration is built with CloudFormation.
The CloudFormation templates are located at the following URL
https://github.com/awstut-an-r/awstut-fa/tree/main/070
Explanation of key points of the template files
For basic information on ECS (Fargate), please refer to the following page
For information on how to deploy Fargate on a private subnet, please refer to the following page
For information on how to use CloudFormation custom resource to automatically remove NAT gateways, etc., please see the following page
SNS Topic
Resources:
  Topic:
    Type: AWS::SNS::Topic
    Properties:
      Subscription:
        - Endpoint: !Ref MailAddress
          Protocol: email
      TopicName: !Ref Prefix
Code language: YAML (yaml)
The Subscription property is the key.
To specify an email address as a subscriber, specify “email” in the Protocol property and the email address in the Endpoint property.
For details on how to specify an email address as an SNS subscriber, please refer to the following page.
VPC Endpoint
Resources:
  CloudWatchMetricsEndpoint:
    Type: AWS::EC2::VPCEndpoint
    Properties:
      PrivateDnsEnabled: true
      SecurityGroupIds:
        - !Ref EndpointSecurityGroup2
      ServiceName: !Sub "com.amazonaws.${AWS::Region}.monitoring"
      SubnetIds:
        - !Ref ContainerSubnet
      VpcEndpointType: Interface
      VpcId: !Ref VPC
Code language: YAML (yaml)
To deliver Fargate metrics deployed on a private subnet to CloudWatch, create a VPC endpoint for the metrics.
Below is the security group to be applied to this endpoint.
Resources:
  EndpointSecurityGroup2:
    Type: AWS::EC2::SecurityGroup
    Properties:
      GroupName: !Sub "${Prefix}-EndpointSecurityGroup2"
      GroupDescription: Allow HTTPS from ContainerSecurityGroup.
      VpcId: !Ref VPC
      SecurityGroupIngress:
        - IpProtocol: tcp
          FromPort: !Ref HTTPSPort
          ToPort: !Ref HTTPSPort
          SourceSecurityGroupId: !Ref ContainerSecurityGroup
Code language: YAML (yaml)
The contents allow inbound communication of 443/tcp with the security group applied to Fargate as the source.
CloudWatch Alarm
Resources:
  Alarm:
    Type: AWS::CloudWatch::Alarm
    Properties:
      AlarmActions:
        - !Ref TopicArn
      ComparisonOperator: GreaterThanThreshold
      Dimensions:
        - Name: ClusterName
          Value: !Ref ClusterName
        - Name: ServiceName
          Value: !Ref ServiceName
      EvaluationPeriods: 1
      MetricName: CPUUtilization
      Namespace: AWS/ECS
      Period: 60
      Statistic: Average
      Threshold: 0.1
Code language: YAML (yaml)
In the AlarmActions property, set the actions to be performed when alarm conditions are met.
Specify the SNS topic mentioned above and register it with the SNS publisher.
Set the target service for which metrics are collected in the Namespace property.
To collect ECS/Fargate metrics, specify “AWS/ECS”.
Set the metrics to be collected in the MetricName property.
Since we want to collect CPU utilization, specify “CPUUtilization”.
In the Dimensions property, specify the characteristics to identify the target ECS/Fargate resource.
For ECS/Fargate, two characteristics can be set
- ClusterName: Name of the ECS cluster
- ServiceName: Name of the ECS service
Set alarm conditions with the ComparisonOperator, EvaluationPeriods, Period, Statistic, and Threshold properties.
To summarize, CPU usage is evaluated every 60 seconds, and if the average value of the metrics for the past one time exceeds 0.1%, the alarm condition is satisfied.
(Reference) EC2 instance
Resources:
  Instance:
    Type: AWS::EC2::Instance
    Properties:
      IamInstanceProfile: !Ref InstanceProfile
      ImageId: !Ref ImageId
      InstanceType: !Ref InstanceType
      NetworkInterfaces:
        - DeviceIndex: 0
          SubnetId: !Ref InstanceSubnet
          GroupSet:
            - !Ref InstanceSecurityGroup
      UserData: !Base64 |
        #!/bin/bash -xe
        yum update -y
        yum install httpd -y
Code language: YAML (yaml)
No special configuration is required.
In the UserData property, state that Apache is to be installed when the instance is initialized.
For more information on UserData, please refer to the following page
Architecting
Use CloudFormation to build this environment and check the actual behavior.
Create CloudFormation stacks and check resources in stacks
Create CloudFormation stacks.
For information on how to create stacks and check each stack, please refer to the following page
After checking the resources in each stack, information on the main resources created this time is as follows
- SNS topic: fa-070
- ECS cluster: fa-070-cluster
- ECS service: fa-070-service
- EC2 instance: i-02da326aa09a0a86c
Authentication of email address
If you have specified an email address as a subscriber to an SNS topic, you must authenticate that email address.
For details, please refer to the following page
Resource Confirmation
Check each resource from the AWS Management Console.
Check the SNS topic.
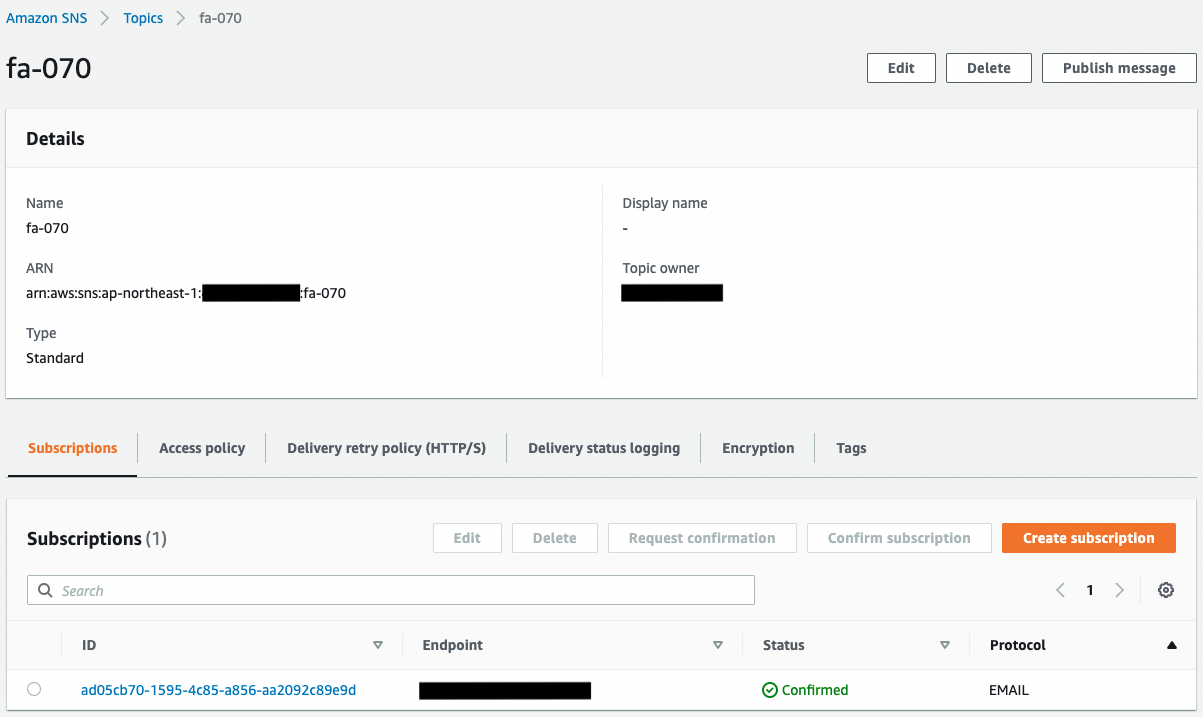
You can see that the SNS topic has been successfully created.
In addition, you can see that the email address registered as a subscriber is registered.
The Status value of the email address is “Confirmed,” indicating that the authentication has been completed.
Next, check ECS (Fargate).
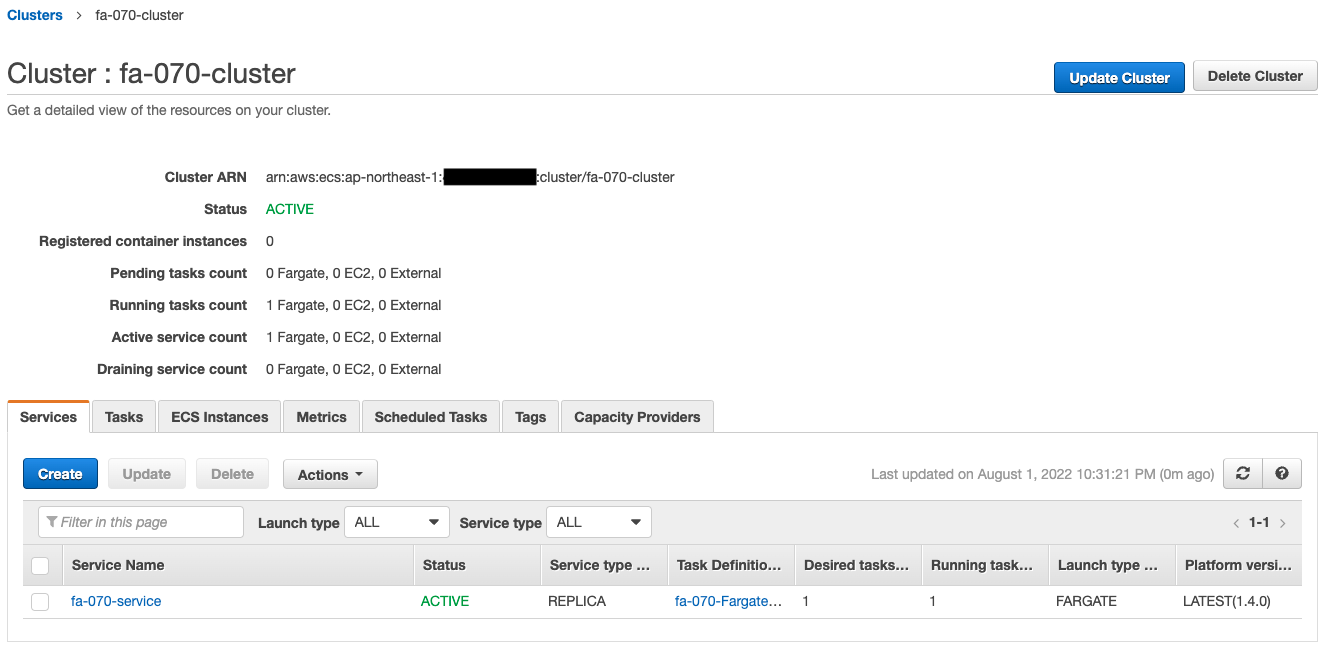
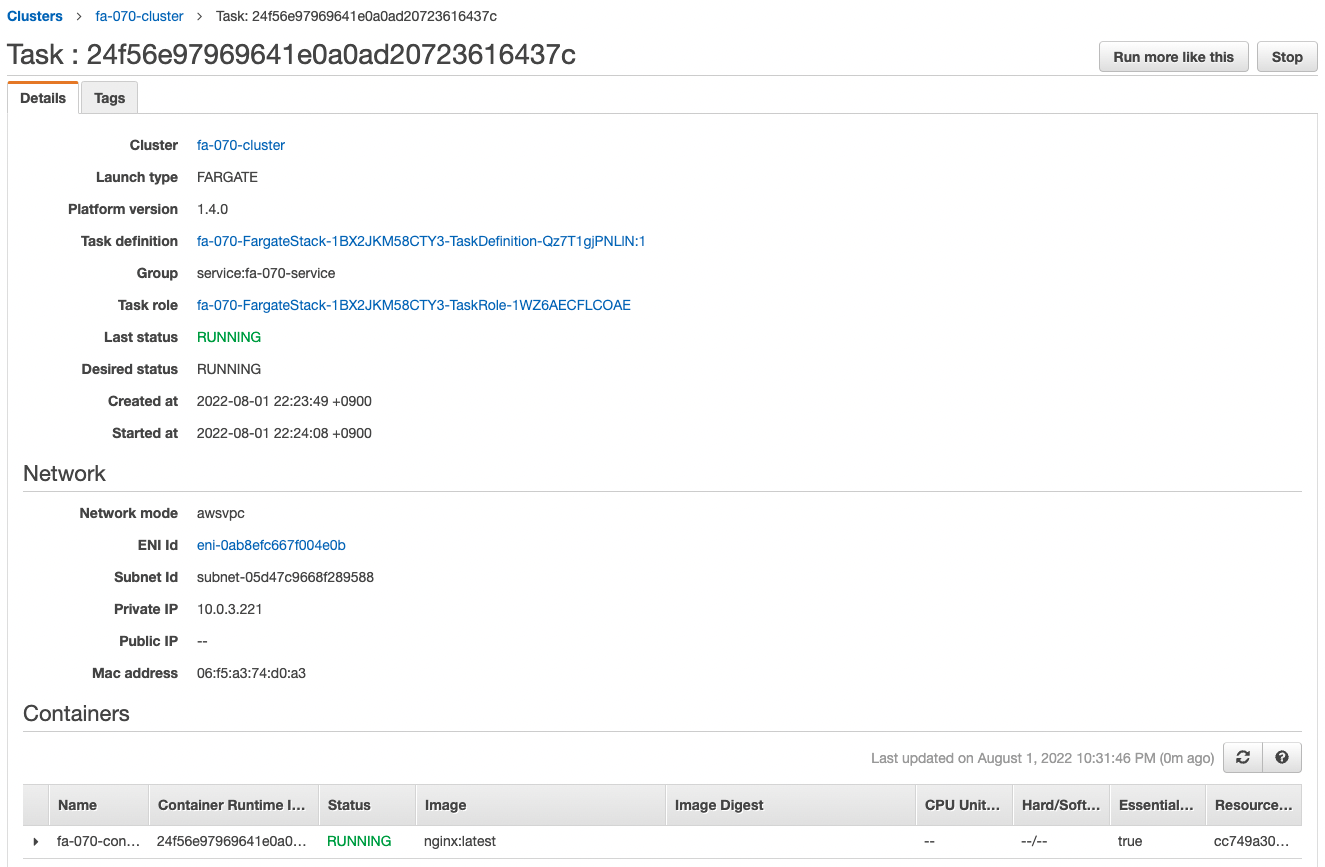
The ECS cluster service task has been successfully created.
The latest version of Nginx image is obtained from Dockerhub and a container is created from it.
You can also see that the private address assigned to the task is “10.0.3.221”.
Check the CloudWatch alarm.
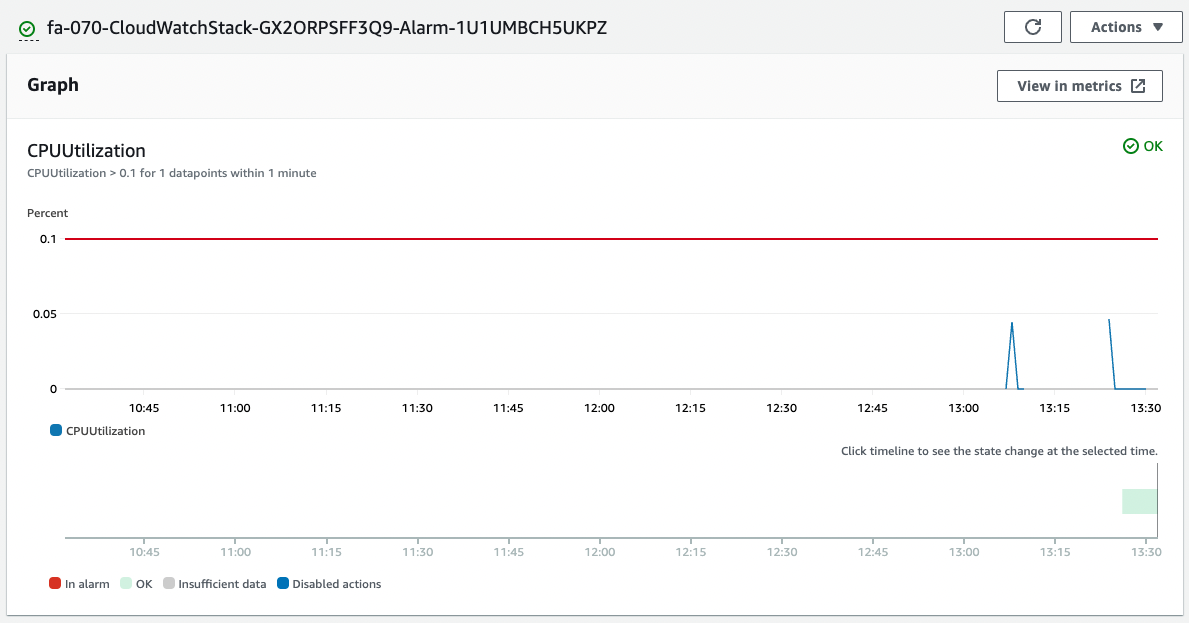
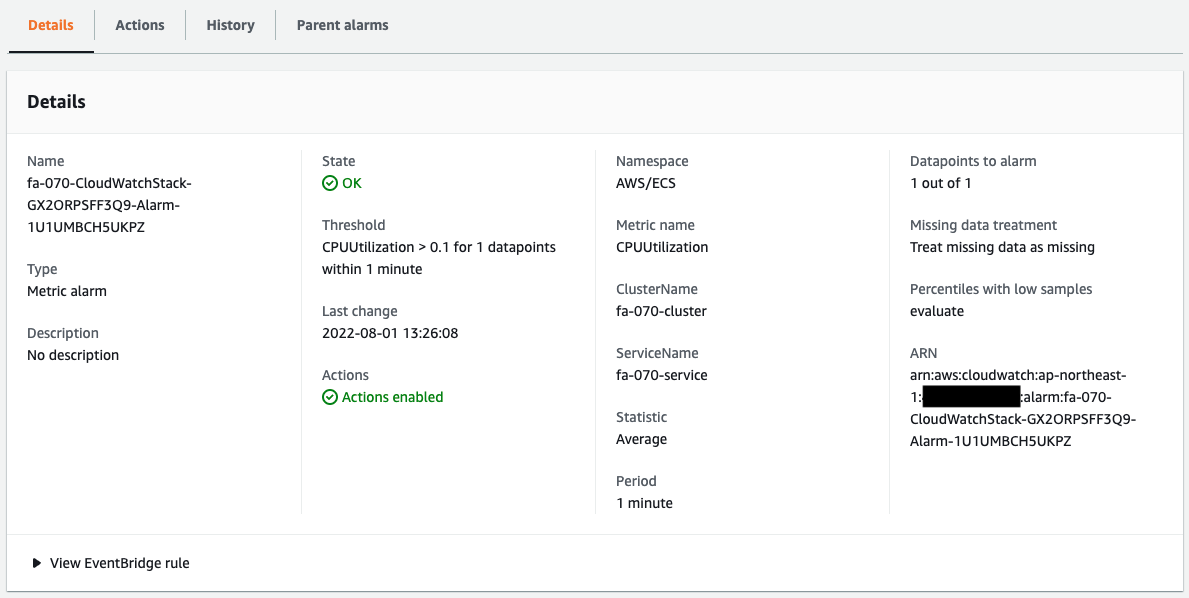
The alarm has been successfully created.
Based on the dimension information, we are able to collect the CPU usage of Fargate that we have just confirmed.
Since it is currently below the threshold of 0.1%, the status is “OK” and it is not in an alarm state.
Checking Action
Now that everything is ready, access the EC2 instance.
Use SSM Session Manager to access the instance.
% aws ssm start-session --target i-02da326aa09a0a86c

Starting session with SessionId: root-0a2289244a1ac6d6f
sh-4.2$
Code language: Bash (bash)
For more information on SSM Session Manager, please refer to the following page
Access the container in the task using the curl command.
sh-4.2$ curl http://10.0.3.221/
<!DOCTYPE html>
<html>
<head>
<title>Welcome to nginx!</title>
<style>
html { color-scheme: light dark; }
body { width: 35em; margin: 0 auto;
font-family: Tahoma, Verdana, Arial, sans-serif; }
</style>
</head>
<body>
<h1>Welcome to nginx!</h1>
<p>If you see this page, the nginx web server is successfully installed and
working. Further configuration is required.</p>

<p>For online documentation and support please refer to
<a href="http://nginx.org/">nginx.org</a>.<br/>
Commercial support is available at
<a href="http://nginx.com/">nginx.com</a>.</p>

<p><em>Thank you for using nginx.</em></p>
</body>
</html>
Code language: Bash (bash)
We were able to access the site successfully.
We can see that the Nginx container is in action on Fargate.
We will now increase Fargate’s CPU utilization to trigger an action on the CloudWatch alarm.
To increase CPU utilization, we will use Apache Bench to generate and load a large number of requests.
First, make sure Apache is installed.
sh-4.2$ sudo yum list installed | grep httpd
generic-logos-httpd.noarch            18.0.0-4.amzn2                 @amzn2-core
httpd.aarch64                         2.4.54-1.amzn2                 @amzn2-core
httpd-filesystem.noarch               2.4.54-1.amzn2                 @amzn2-core
httpd-tools.aarch64                   2.4.54-1.amzn2                 @amzn2-core
Code language: Bash (bash)
It appears that Apache has been successfully installed according to the user data.
Run Apache Bench.
Generate 100,000 requests for a container (task) on Fargate.
sh-4.2$ ab -n 100000 http://10.0.3.221/
This is ApacheBench, Version 2.3 <$Revision: 1901567 $>
Copyright 1996 Adam Twiss, Zeus Technology Ltd, http://www.zeustech.net/
Licensed to The Apache Software Foundation, http://www.apache.org/

Benchmarking 10.0.3.221 (be patient)
Completed 10000 requests
Completed 20000 requests
Completed 30000 requests
Completed 40000 requests
Completed 50000 requests
Completed 60000 requests
Completed 70000 requests
Completed 80000 requests
Completed 90000 requests
Completed 100000 requests
Finished 100000 requests


Server Software:        nginx/1.23.1
Server Hostname:        10.0.3.221
Server Port:            80

Document Path:          /
Document Length:        615 bytes

Concurrency Level:      1
Time taken for tests:   37.224 seconds
Complete requests:      100000
Failed requests:        0
Total transferred:      84800000 bytes
HTML transferred:       61500000 bytes
Requests per second:    2686.45 [#/sec] (mean)
Time per request:       0.372 [ms] (mean)
Time per request:       0.372 [ms] (mean, across all concurrent requests)
Transfer rate:          2224.71 [Kbytes/sec] received

Connection Times (ms)
              min  mean[+/-sd] median   max
Connect:        0    0   0.1      0       6
Processing:     0    0   0.1      0      11
Waiting:        0    0   0.1      0      11
Total:          0    0   0.1      0      11

Percentage of the requests served within a certain time (ms)
  50%      0
  66%      0
  75%      0
  80%      0
  90%      1
  95%      1
  98%      1
  99%      1
 100%     11 (longest request)
Code language: Bash (bash)
The load from the Apache Bench should have increased CPU usage.
Check CloudWatch alarms again.
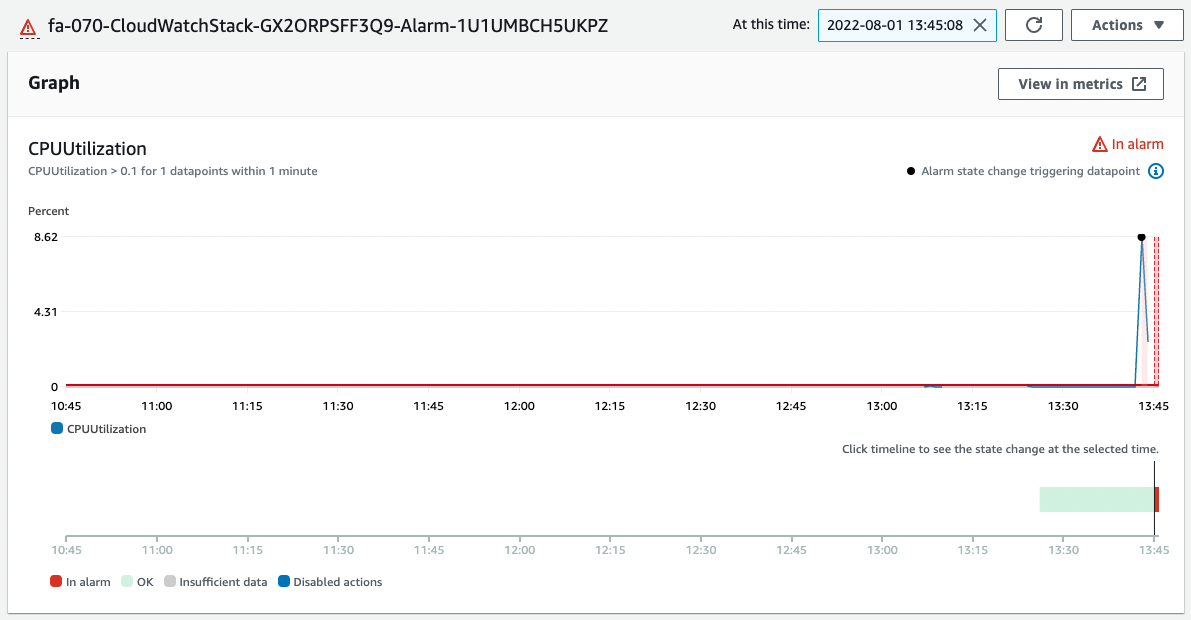
CPU utilization has exceeded 8%.
The alarm threshold has been exceeded and the status has changed from “OK” to “In alarm”.
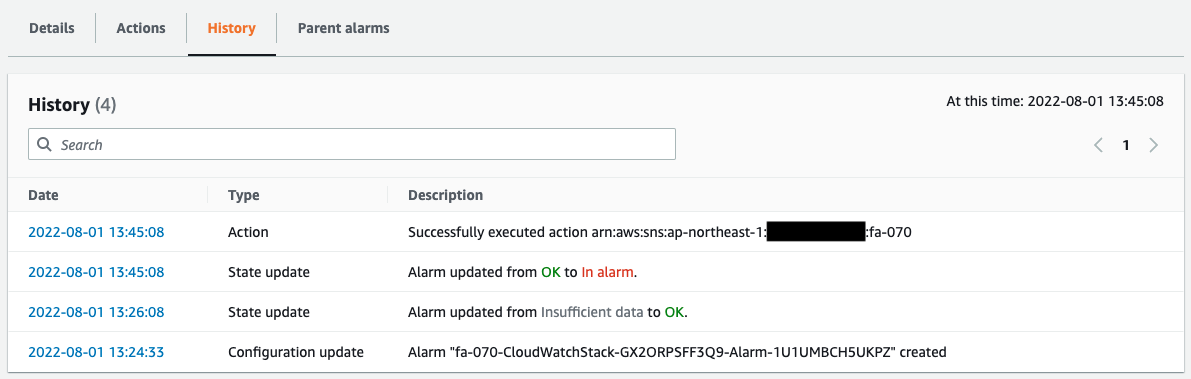
The history shows that a message was sent to the SNS as an Action due to the alarm status.
The following email was immediately sent to the registered address.
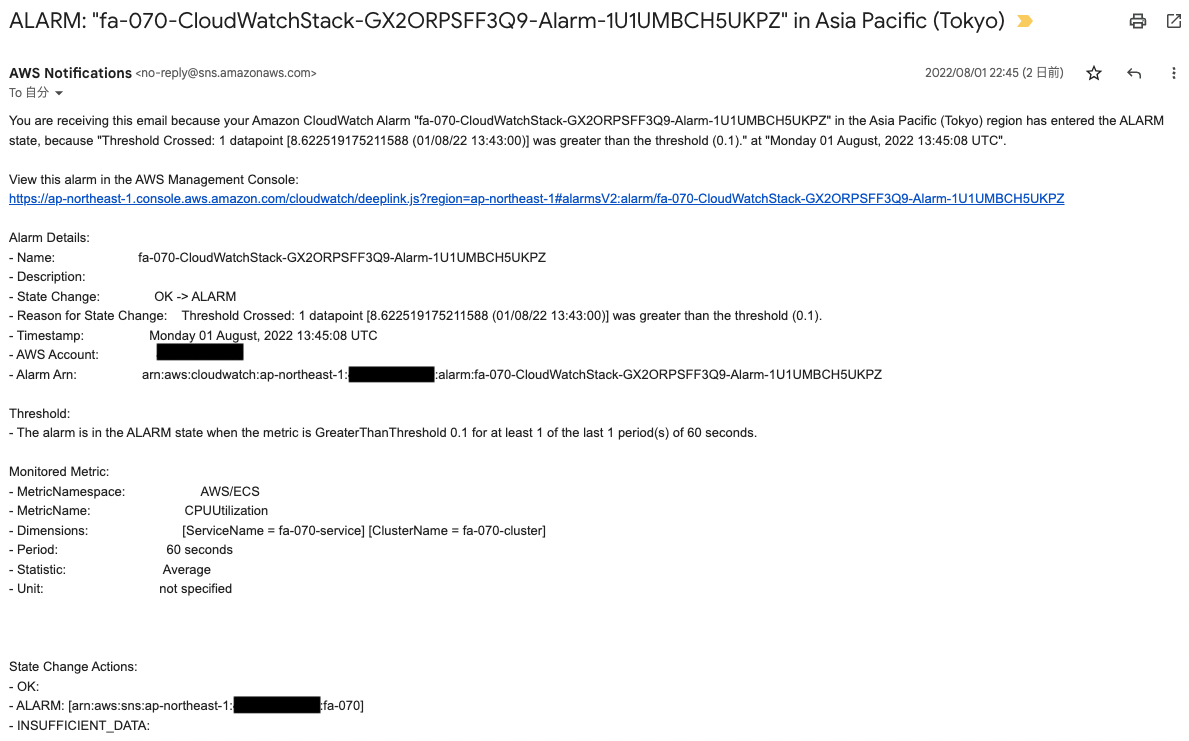
The body of the email is the content of the CloudWatch alarm.
By using CloudWatch alarm in this way, we were able to notify via email when certain metrics exceeded threshold values, in conjunction with SNS.
Summary
We have seen how CloudWatch alarm can be used to set threshold values for Fargate metrics and notify by email when the limits are exceeded.