Enable Container Insights in Fargate and set alarms with traffic
In the following page, we introduced a configuration for Fargate type ECS that uses CloudWatch alarms to send email notifications when CPU usage exceeds a threshold value.
You can get more detailed metrics by enabling the Container Insight feature for ECS clusters.
This time, we aim to use the traffic information obtained by Container Insight to notify via CloudWatch alarm via email.
Environment
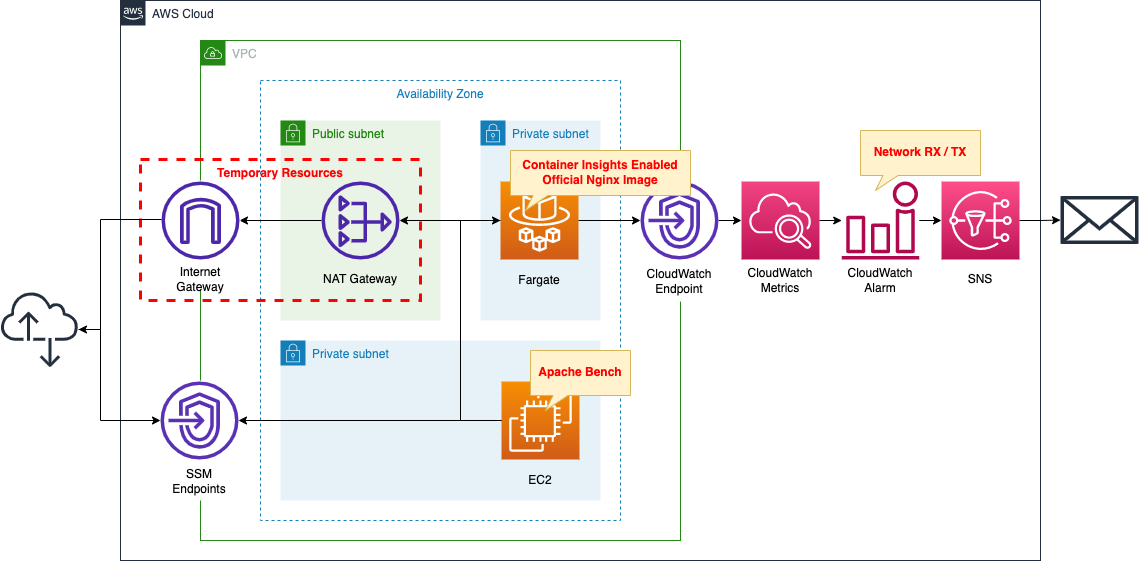
Create a Fargate type ECS on a private subnet.
Enable Container Insight for the ECS cluster.
Create a VPC endpoint for metrics on the container subnet to deliver metrics from the private subnet to CloudWatch.
Set thresholds in CloudWatch alarms for network send/receive volume.
Set up SNS to publish a message when communication volume exceeds 100Bytes/Sec.
Set the SNS as a subscriber with an email address.
Create an EC2 instance.
Use it as a client to access the container.
Create a NAT gateway for two purposes.
The first is to get an official Nginx image from DockerHub in order to create an ECS container.
The second is to install Apache Bench on the EC2 instance, which will run against the ECS container and generate a large number of requests, which will increase CPU usage and raise alarms.
Once the above uses are completed, the NAT gateway is no longer needed.
In this case, we will use a CloudFormation custom resource and configure it to eventually remove the NAT gateway, etc.
CloudFormation Template Files
The above configuration is built using CloudFormation.
The CloudFormation templates are located at the following URL
https://github.com/awstut-an-r/awstut-fa/tree/main/072
Explanation of key points of the template files
This configuration is basically the same as the page introduced at the beginning of this document.
This page focuses on how to enable Container Insight and set alarms from the metrics that can be obtained from it.
Enabling Container Insight
Resources:
  Cluster:
    Type: AWS::ECS::Cluster
    Properties:
      ClusterName: !Sub "${Prefix}-cluster"
      ClusterSettings:
        - Name: containerInsights
          Value: enabled
Code language: YAML (yaml)
Container Insight is enabled on the cluster resource.
In the ClusterSettings property, set “containerInsights” to Name and “enabled” to Value to enable Container Insight.
CloudWatch Alarm
Resources:
  Alarm1:
    Type: AWS::CloudWatch::Alarm
    Properties:
      AlarmActions:
        - !Ref TopicArn
      ComparisonOperator: GreaterThanThreshold
      Dimensions:
        - Name: ClusterName
          Value: !Ref ClusterName
        - Name: ServiceName
          Value: !Ref ServiceName
      EvaluationPeriods: 1
      MetricName: NetworkRxBytes
      Namespace: ECS/ContainerInsights
      Period: 60
      Statistic: Average
      Threshold: 100
      Unit: Bytes/Second

  Alarm2:
    Type: AWS::CloudWatch::Alarm
    Properties:
      AlarmActions:
        - !Ref TopicArn
      ComparisonOperator: GreaterThanThreshold
      Dimensions:
        - Name: ClusterName
          Value: !Ref ClusterName
        - Name: ServiceName
          Value: !Ref ServiceName
      EvaluationPeriods: 1
      MetricName: NetworkTxBytes
      Namespace: ECS/ContainerInsights
      Period: 60
      Statistic: Average
      Threshold: 100
      Unit: Bytes/Second
Code language: YAML (yaml)
To set CloudWatch alarms using metrics available from Container Insight, set the Namespace property to “ECS/ContainerInsights”.
To condition the metrics to be retrieved on the cluster service level, specify “ClusterName” and “ServiceName” for the Dimensions property.
Network-related information that can be retrieved from Container Insight includes “NetworkRxBytes” and “NetworkTxBytes”.
These are the amount of data received and sent, respectively.
Set the MetricName properties of the two alarms, respectively.
Set the alarm conditions in the ComparisonOperator, EvaluationPeriods, Period, Statistic, and Threshold properties.
In summary, the system evaluates the amount of data received/sent every 60 seconds, and if the average value of the metrics for the past one time exceeds 100Bytes/Sec, the alarm condition is satisfied.
Architecting
Using CloudFormation, we will build this environment and check the actual behavior.
Create CloudFormation stacks and check resources in stacks
Create CloudFormation stacks.
For information on how to create stacks and check each stack, please refer to the following page
After checking the resources in each stack, information on the main resources created this time is as follows
- SNS topic: fa-072
- ECS cluster: fa-072-cluster
- ECS service: fa-072-service
- EC2 instance: i-06b8f677825287fba
Authentication of email address
If you have specified an email address as a subscriber to an SNS topic, you must authenticate that email address.
For more information, please refer to the following page.
Resource Confirmation
Check each resource from the AWS Management Console.
Check the SNS topic.
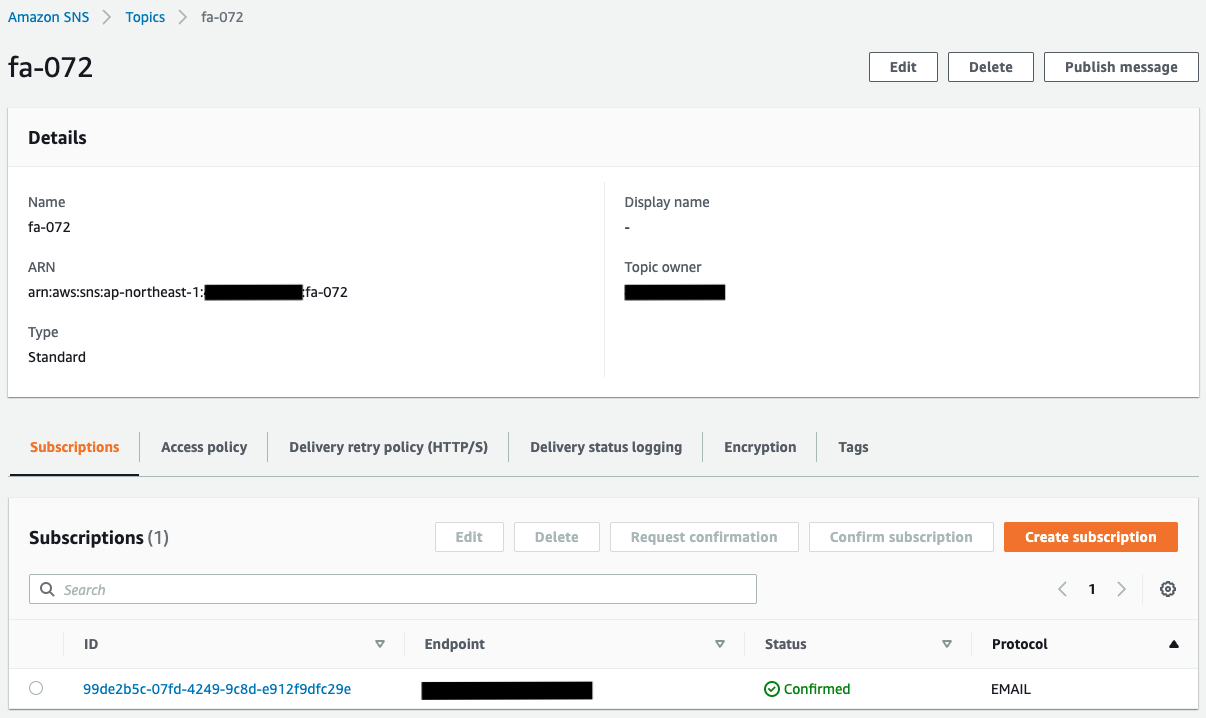
You can see that the SNS topic has been successfully created.
In addition, you can see that the email address registered as a subscriber is registered.
The Status value of the email address is “Confirmed,” indicating that the authentication has been completed.
Next, check ECS (Fargate).
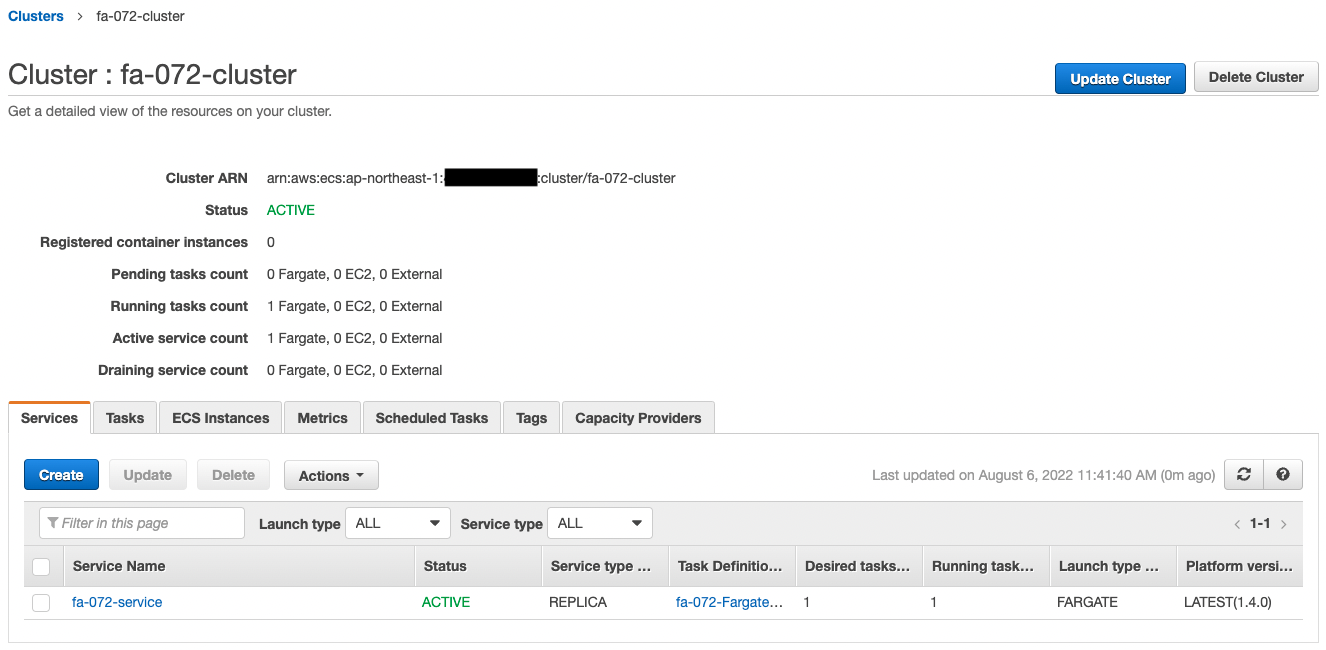
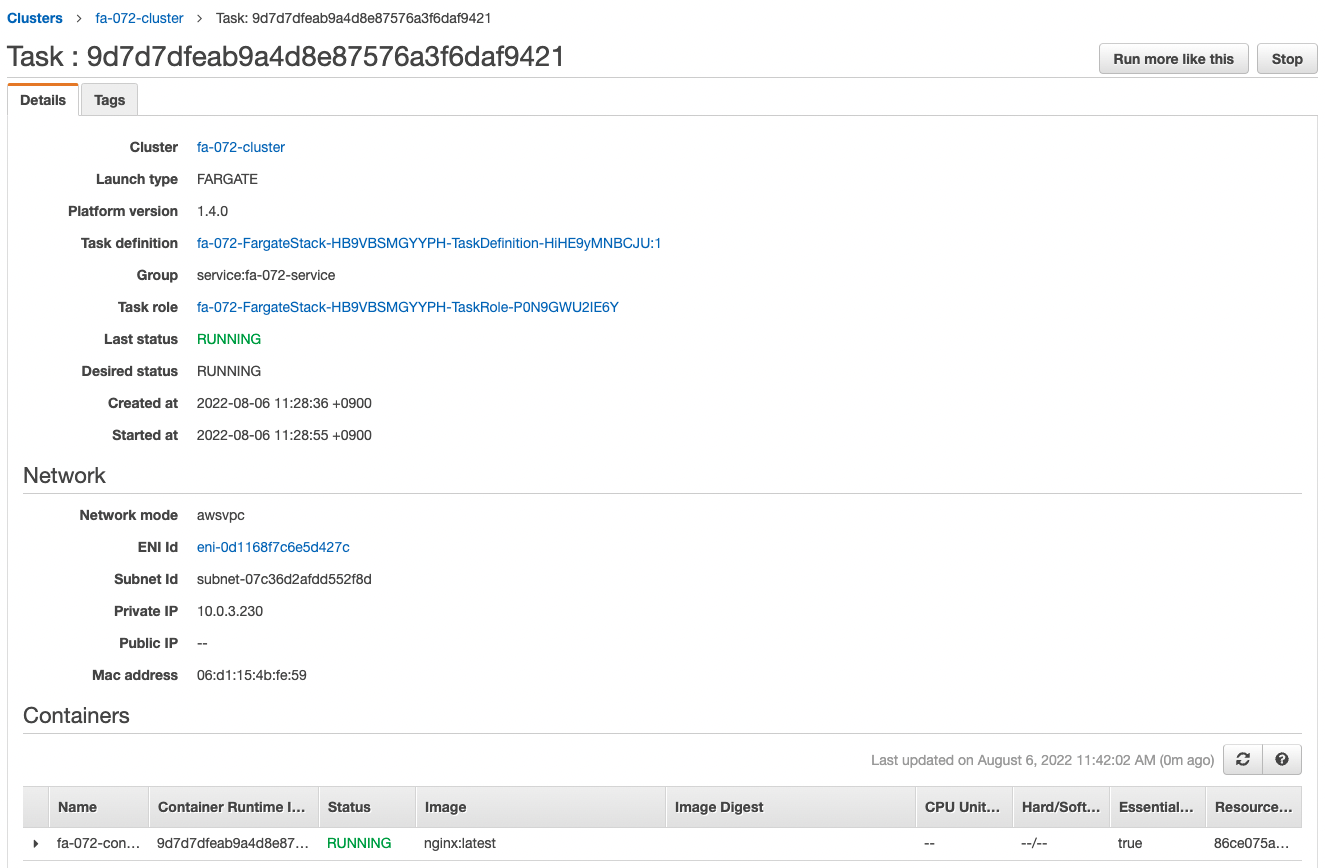
The ECS cluster service task has been successfully created.
The latest version of Nginx image is obtained from Dockerhub and a container is created from it.
You can also see that the private address assigned to the task is “10.0.3.230”.
Check the CloudWatch alarms.
First is the alarm for the amount received.
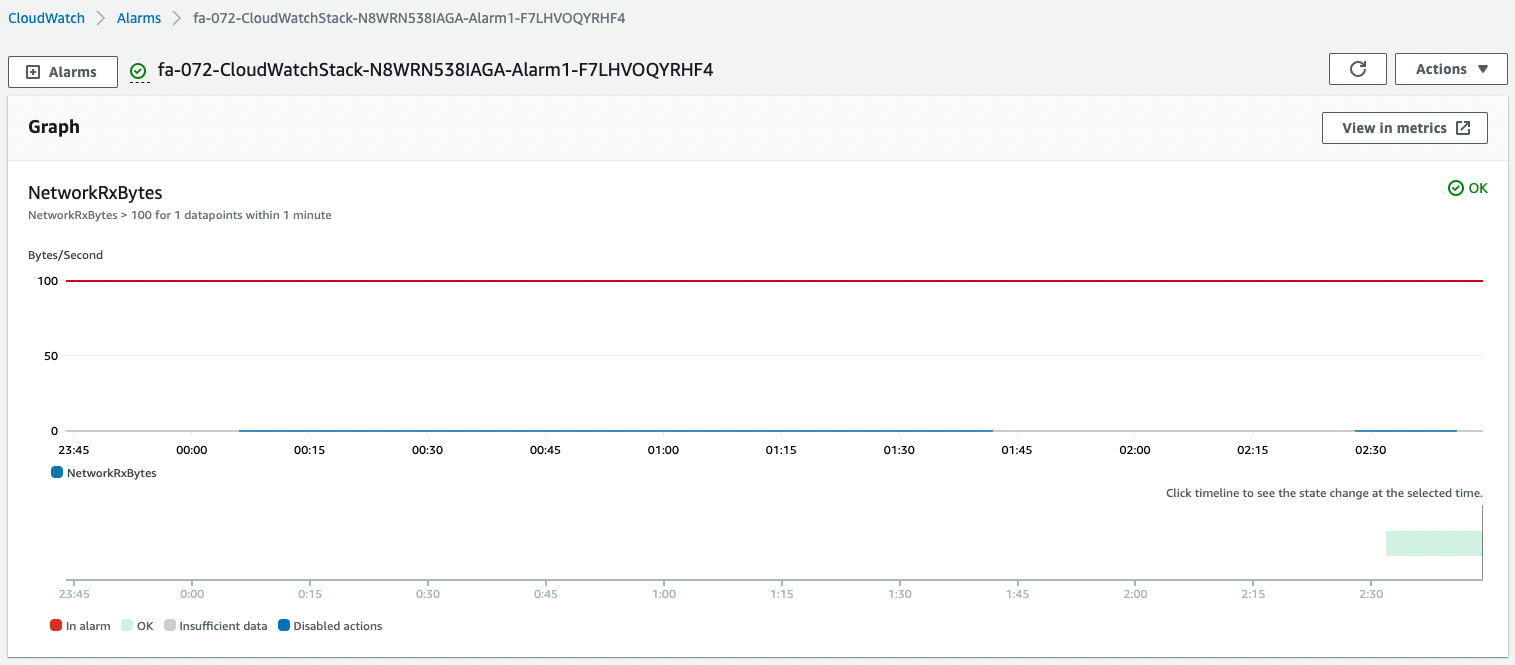
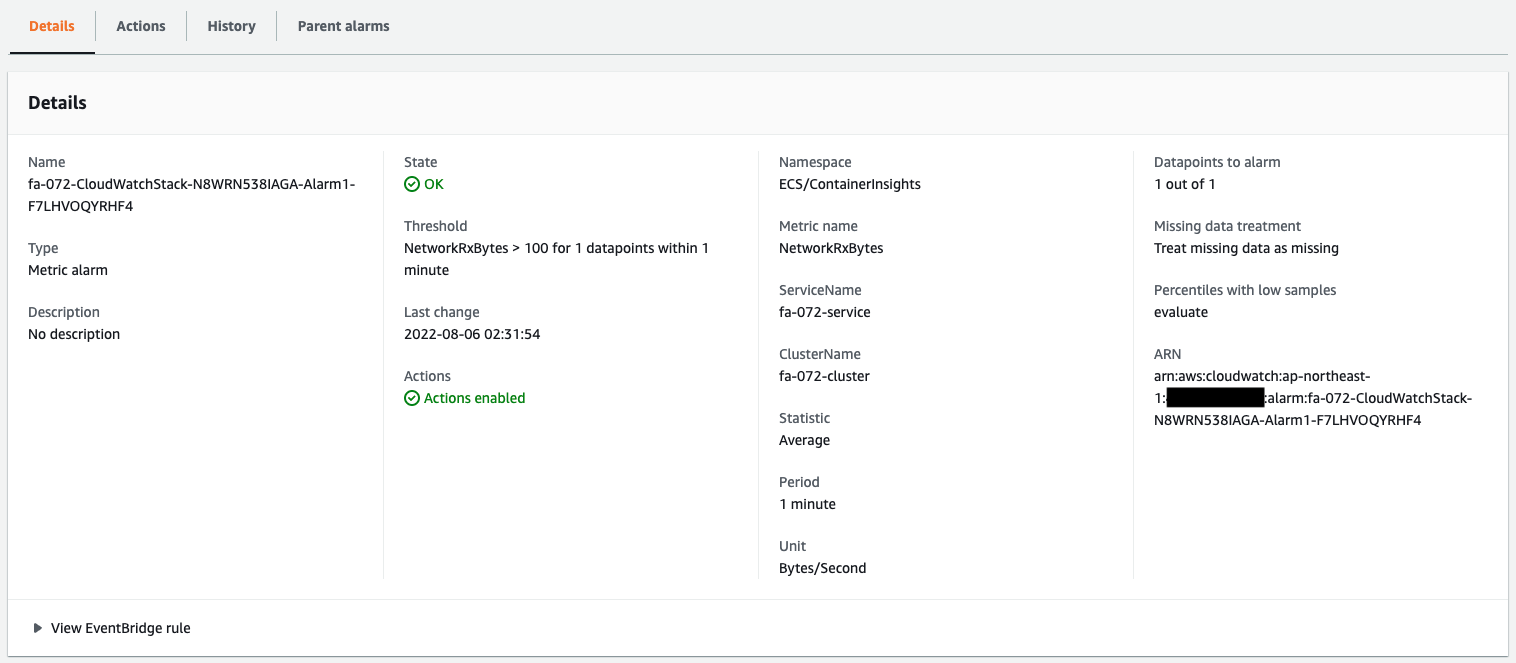
The alarm is successfully created.
Since it is currently below the threshold value of 100 Bytes/Sec, the status is “OK” and it is not in an alarm state.
Next is the alarm for the transmission volume.
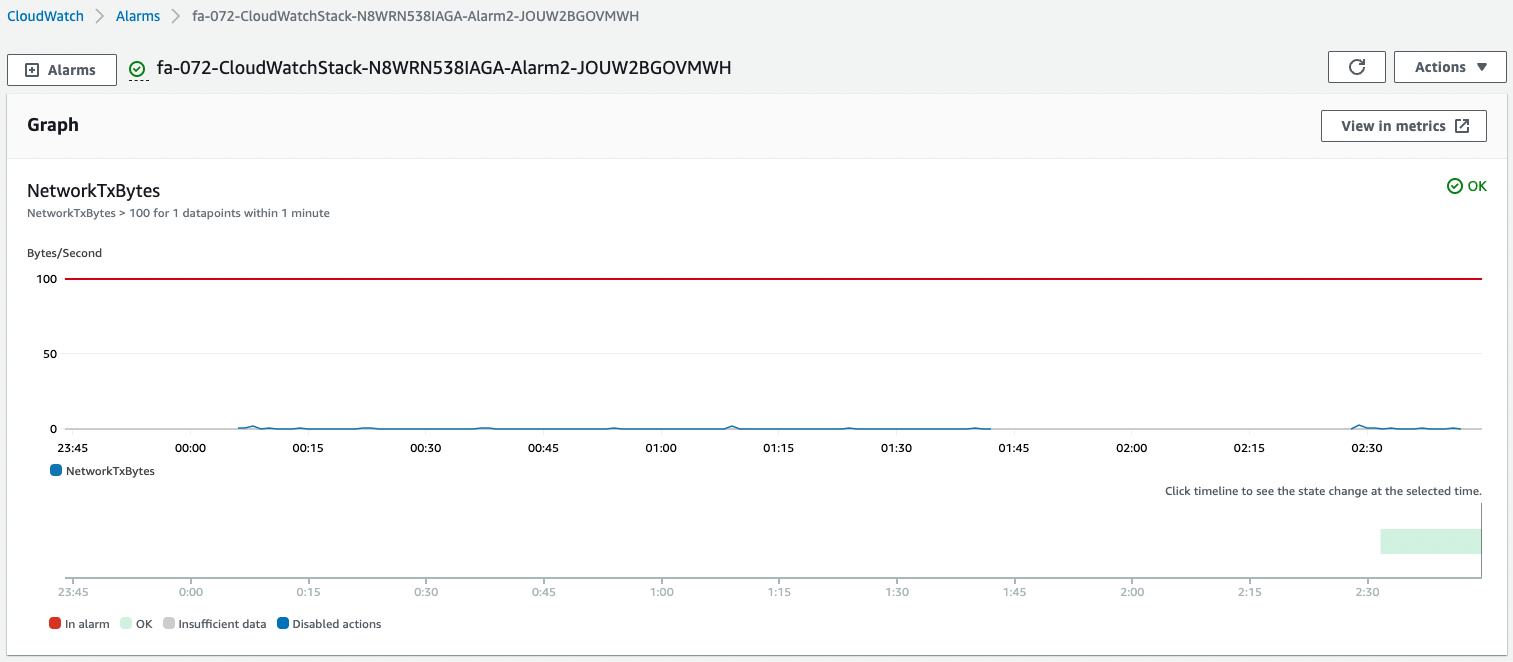
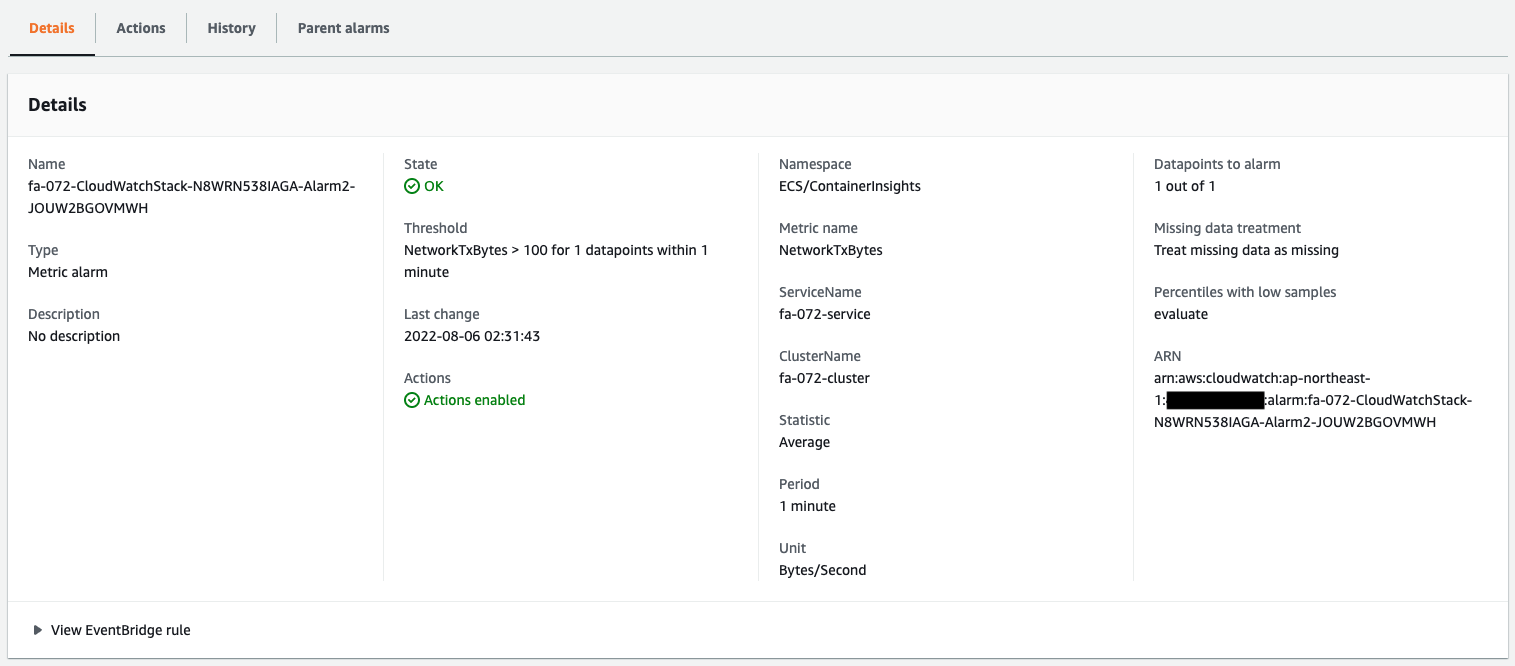
This alarm is also created normally.
Since the value is currently below the threshold value of 100 Bytes/Sec, the status is “OK” and no alarm is generated.
Checking Action
Now that everything is ready, access the EC2 instance.
Use SSM Session Manager to access the instance.
% aws ssm start-session --target i-06b8f677825287fba

Starting session with SessionId: root-089994be40366b049
sh-4.2$
Code language: Bash (bash)
For more information on SSM Session Manager, please refer to the following page
Access the container in the task using the curl command.
sh-4.2$ curl http://10.0.3.230/
<!DOCTYPE html>
<html>
<head>
<title>Welcome to nginx!</title>
<style>
html { color-scheme: light dark; }
body { width: 35em; margin: 0 auto;
font-family: Tahoma, Verdana, Arial, sans-serif; }
</style>
</head>
<body>
<h1>Welcome to nginx!</h1>
<p>If you see this page, the nginx web server is successfully installed and
working. Further configuration is required.</p>

<p>For online documentation and support please refer to
<a href="http://nginx.org/">nginx.org</a>.<br/>
Commercial support is available at
<a href="http://nginx.com/">nginx.com</a>.</p>

<p><em>Thank you for using nginx.</em></p>
</body>
</html>
Code language: Bash (bash)
We were able to access the site successfully.
We can see that the Nginx container is in action on Fargate.
We will now increase Fargate’s send/receive volume to trigger an action on the CloudWatch alarm.
To increase the volume of incoming and outgoing traffic, we will use Apache Bench to generate a large number of requests to load the server.
First, make sure Apache is installed.
sh-4.2$ sudo yum list installed | grep httpd
generic-logos-httpd.noarch            18.0.0-4.amzn2                 @amzn2-core
httpd.aarch64                         2.4.54-1.amzn2                 @amzn2-core
httpd-filesystem.noarch               2.4.54-1.amzn2                 @amzn2-core
httpd-tools.aarch64                   2.4.54-1.amzn2                 @amzn2-core
Code language: Bash (bash)
It appears that Apache has been successfully installed by the user data.
Run Apache Bench.
Generate 100,000 requests for a container (task) on Fargate.
sh-4.2$ ab -n 100000 http://10.0.3.230/
This is ApacheBench, Version 2.3 <$Revision: 1901567 $>
Copyright 1996 Adam Twiss, Zeus Technology Ltd, http://www.zeustech.net/
Licensed to The Apache Software Foundation, http://www.apache.org/

Benchmarking 10.0.3.230 (be patient)
Completed 10000 requests
Completed 20000 requests
Completed 30000 requests
Completed 40000 requests
Completed 50000 requests
Completed 60000 requests
Completed 70000 requests
Completed 80000 requests
Completed 90000 requests
Completed 100000 requests
Finished 100000 requests


Server Software:        nginx/1.23.1
Server Hostname:        10.0.3.230
Server Port:            80

Document Path:          /
Document Length:        615 bytes

Concurrency Level:      1
Time taken for tests:   35.863 seconds
Complete requests:      100000
Failed requests:        0
Total transferred:      84800000 bytes
HTML transferred:       61500000 bytes
Requests per second:    2788.38 [#/sec] (mean)
Time per request:       0.359 [ms] (mean)
Time per request:       0.359 [ms] (mean, across all concurrent requests)
Transfer rate:          2309.13 [Kbytes/sec] received

Connection Times (ms)
              min  mean[+/-sd] median   max
Connect:        0    0   0.0      0       1
Processing:     0    0   0.0      0       1
Waiting:        0    0   0.0      0       1
Total:          0    0   0.1      0       1

Percentage of the requests served within a certain time (ms)
  50%      0
  66%      0
  75%      0
  80%      0
  90%      0
  95%      1
  98%      1
  99%      1
 100%      1 (longest request)
Code language: Bash (bash)
The load caused by the Apache Bench should have increased the amount of data sent and received.
Check CloudWatch alarms again.
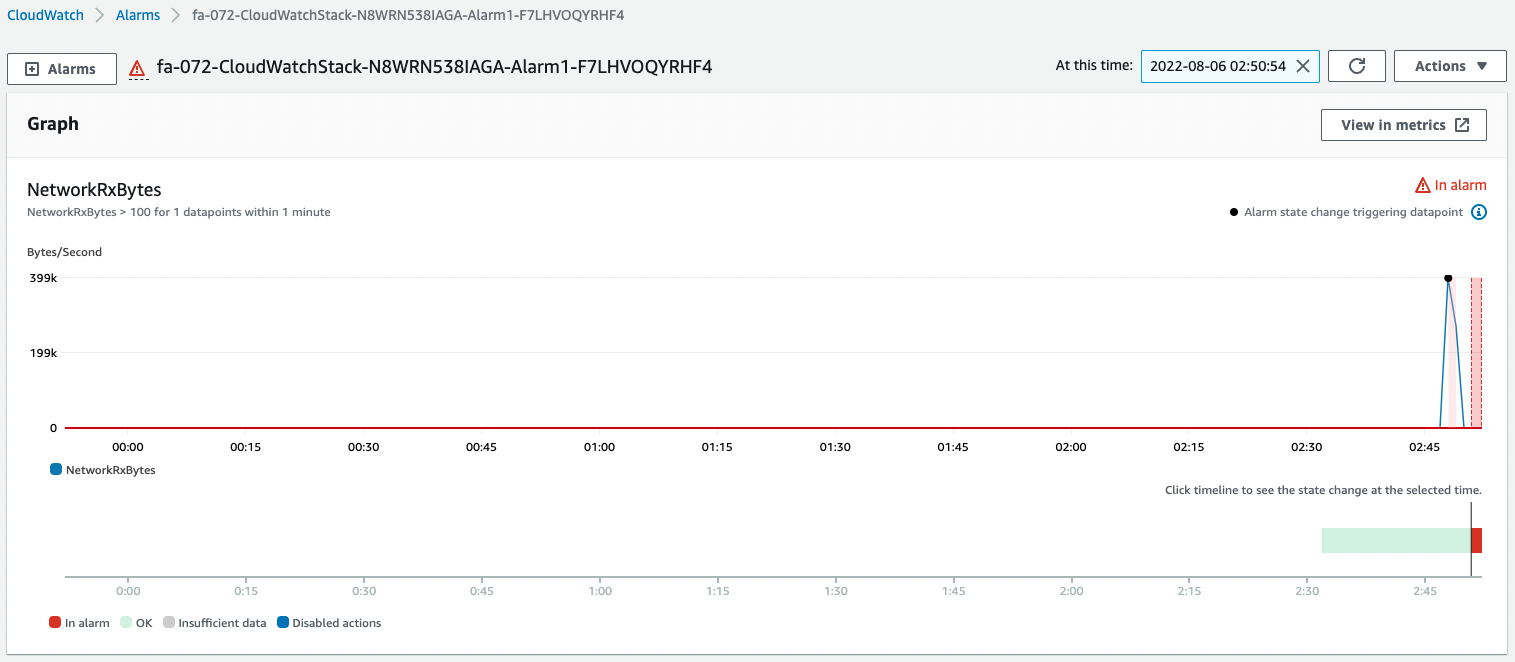
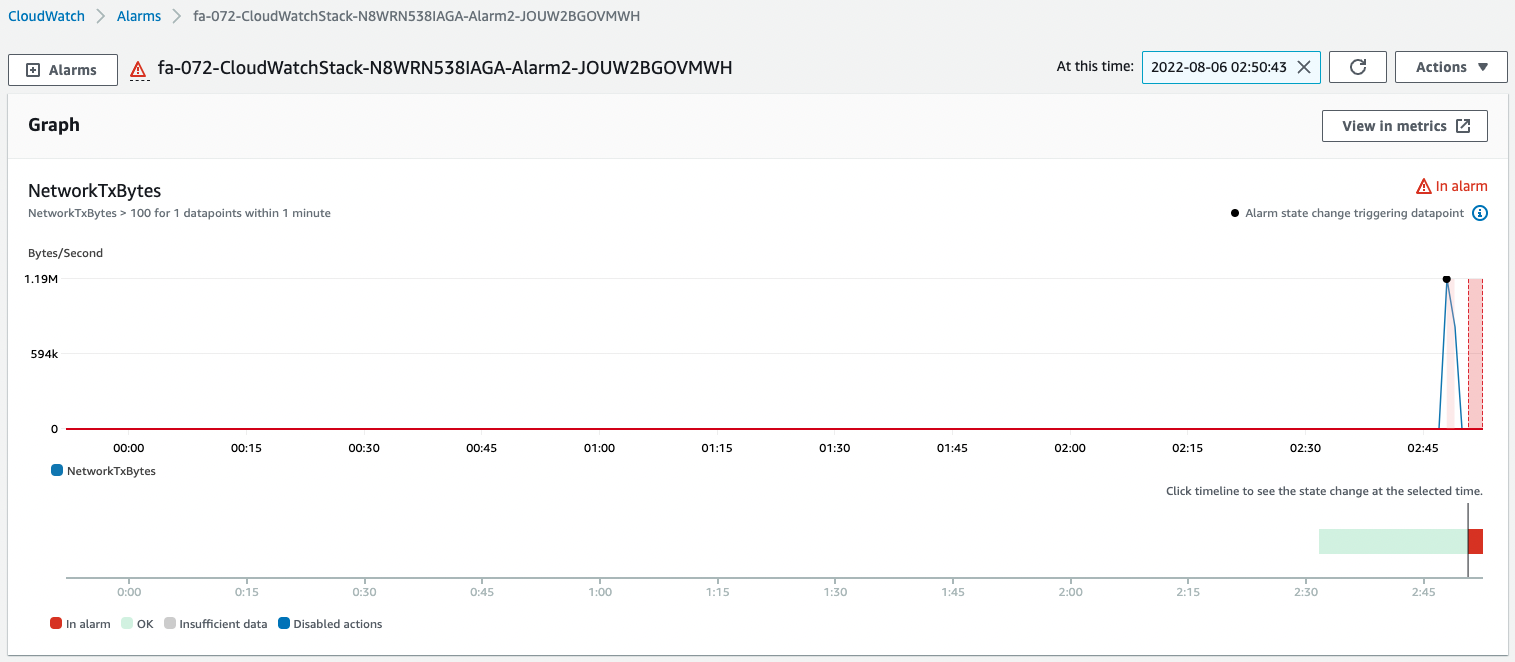
The amount of data sent/received has exceeded 100 Bytes/Sec.
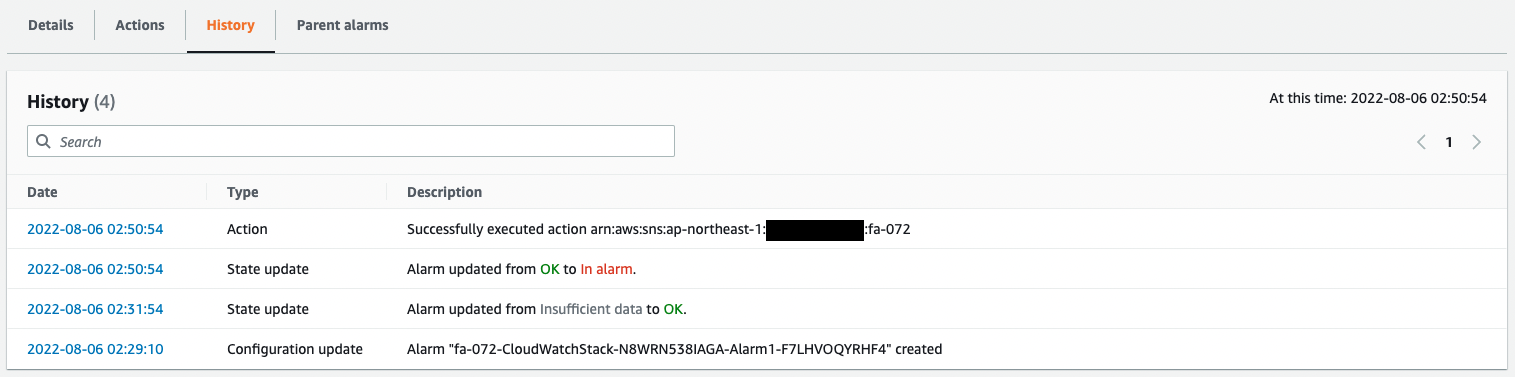
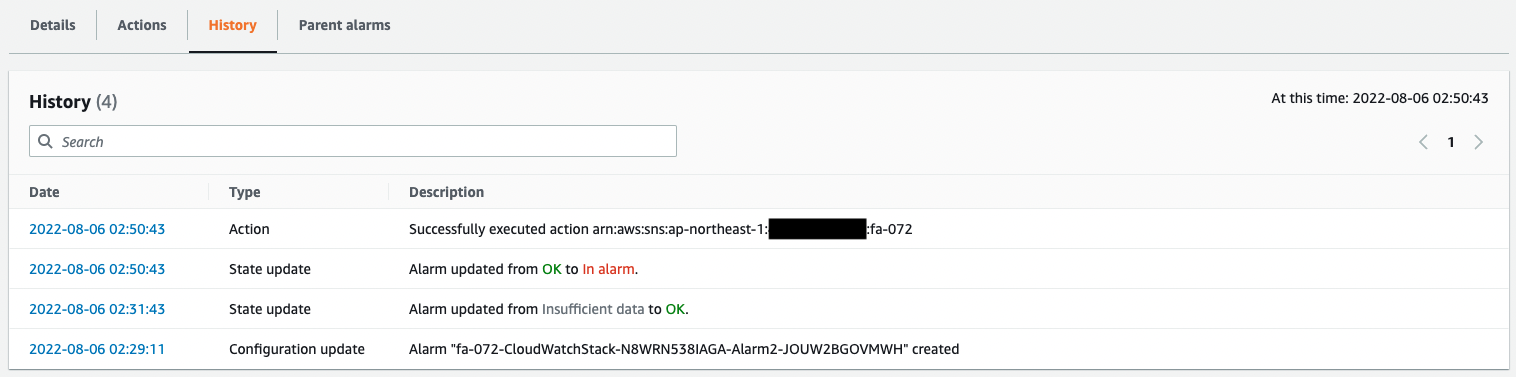
Since the threshold has been exceeded, the two alarm states have been changed from “OK” to “In alarm”.
The history shows that a message was sent to the SNS as an Action due to the alarm status.
You will immediately receive the following two emails to your registered address.
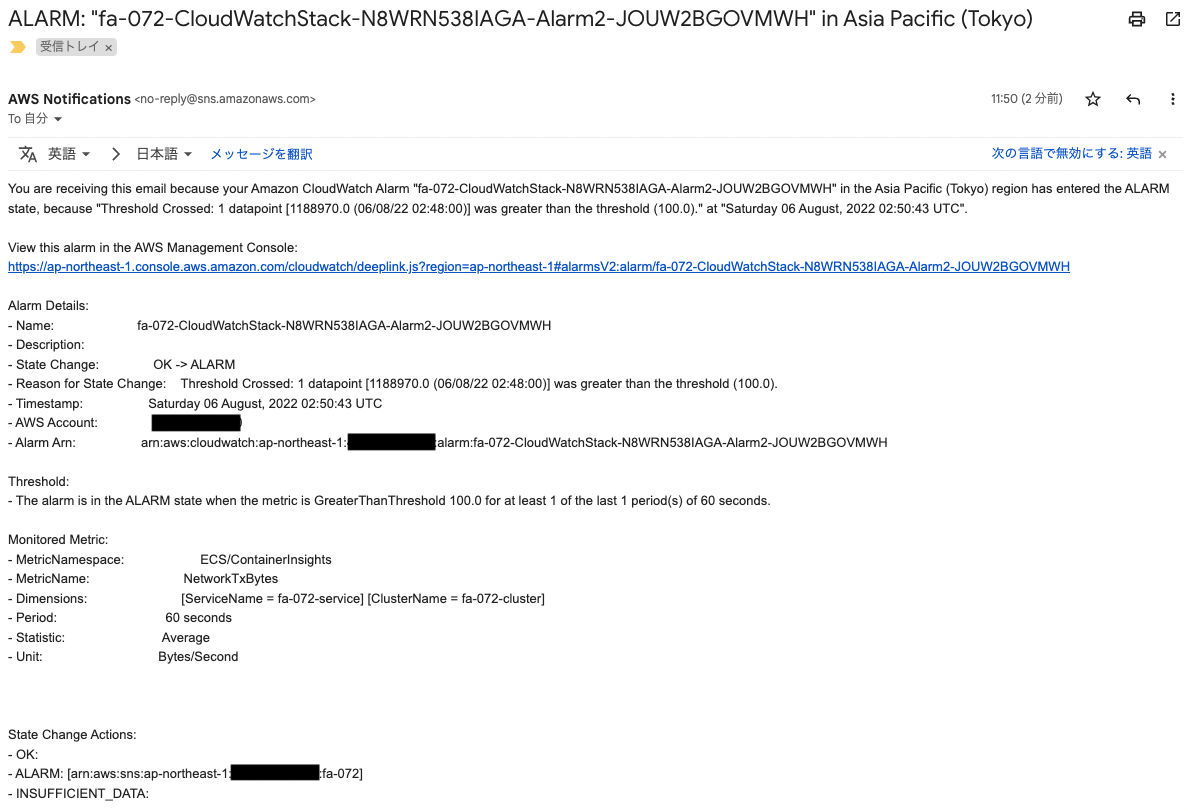
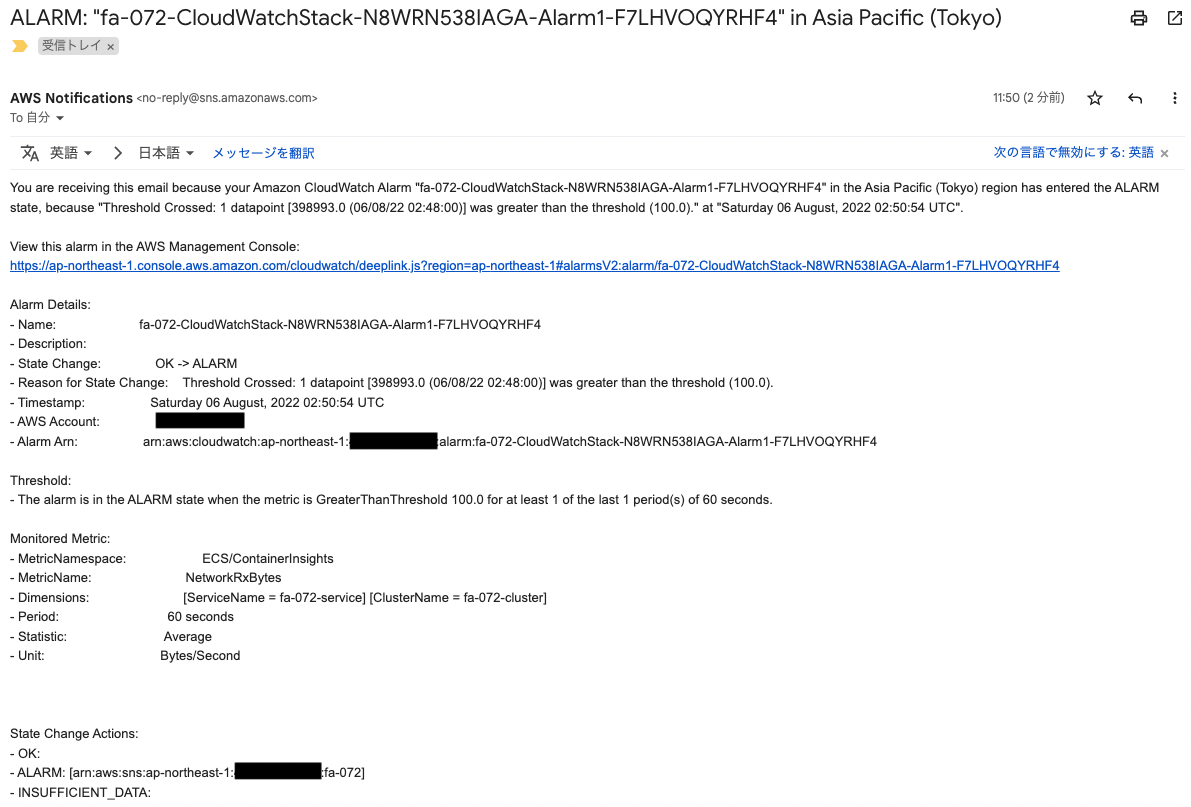
The body of the email is the content of the CloudWatch alarm.
In this way, we were able to use the metrics obtained by Container Insight to send email notifications via CloudWatch alarms.
Summary
We have confirmed how to use the metrics obtained by Container Insight to send email notifications via CloudWatch alarms.