Configuration of EC2 Auto Scaling to scale based on custom metrics
The following page introduced a configuration that scales based on predefined metrics.

The following four predefined metrics are available
・
ASGAverageCPUUtilization—Average CPU utilization of the Auto Scaling group.・
ASGAverageNetworkIn—Average number of bytes received on all network interfaces by the Auto Scaling group.・
ASGAverageNetworkOut—Average number of bytes sent out on all network interfaces by the Auto Scaling group.・
Target tracking scaling policies for Amazon EC2 Auto ScalingALBRequestCountPerTarget—Average Application Load Balancer request count per target for your Auto Scaling group.
If you wish to use a metric other than those listed above, you may specify a custom metric.
In this case, we will install CloudWatch Agent on an EC2 instance (Amazon Linux 2) and create a configuration to scale based on memory utilization.
Environment
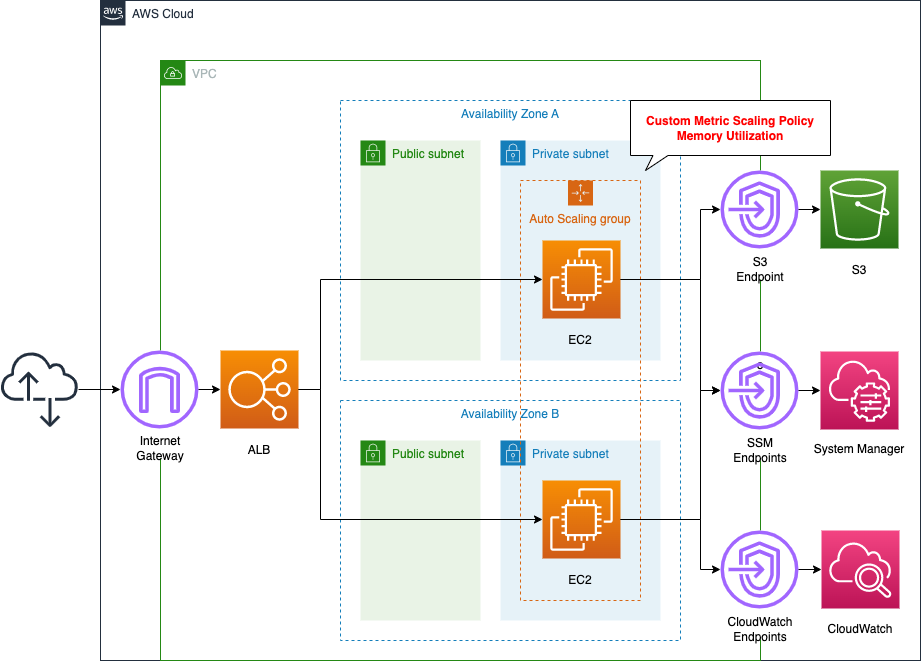
Create an EC2 Auto Scaling group in a private subnet. Instances launched within the group will have Apache installed and run as web servers.
Create various VPC endpoints: endpoints for S3 and SSM to install Apache and CloudWatch agents, and an endpoint for CloudWatch to send custom metrics.
CloudFormation template files
The above configuration is built with CloudFormation. The CloudFormation template is located at the following URL
https://github.com/awstut-an-r/awstut-fa/tree/main/030
Explanation of points in the template files
This configuration is basically the same as the following page.

This page will focus on points that differ from the above page.
Custom Metrics Scaling Policy
Check the policy for scaling in memory. The point is to set properties for custom metrics (CustomizedMetricSpecification) rather than for predefined metrics (PredefinedMetricSpecification).
Resources:
  ScalingPolicy:
    Type: AWS::AutoScaling::ScalingPolicy
    Properties:
      AutoScalingGroupName: !Ref AutoScalingGroup
      PolicyType: TargetTrackingScaling
      TargetTrackingConfiguration:
        CustomizedMetricSpecification:
          Dimensions:
            - Name: AutoScalingGroupName
              Value: !Ref AutoScalingGroupName
          MetricName: mem_used_percent
          Namespace: CWAgent
          Statistic: Average
          Unit: Percent
        TargetValue: !Ref TargetTrackingConfigurationTargetValue
Code language: YAML (yaml)
The configuration details were taken from the official AWS page.
Specify dimensions with the Dimensions property. In this case, the name is AutoScalingGroupName, and the group name is set as the value. This value must match the dimension setting set in the CloudWatch agent described below.
In the MetricName property, specify the name of the metric to be collected. In this case, set this item name to “mem_used_percent” in order to collect memory usage with the CloudWatch agent.
The Statistic and Unit properties define the parameters of the value to be retrieved. In this case, “Average” and “Percent” are specified to get the average value of memory utilization, respectively.
Finally, set the threshold value with the TargetValue property. This time, we will set the scaling to be performed on the condition of 20% memory utilization.
CloudWatch agent configuration for delivering memory utilization
CloudWatch agent settings, but can be stored in the SSM Parameter Store. Please see the following page for details.

In this case, we will focus on memory utilization since we will be distributing it.
Resources:
  CloudWatchConfigParemeter:
    Type: AWS::SSM::Parameter
    Properties:
      Name: AmazonCloudWatch-linux
      Type: String
      Value: |
        {
          "agent": {
            "metrics_collection_interval": 60,
            "run_as_user": "root"
          },
          "metrics": {
            "append_dimensions": {
              "ImageId": "${aws:ImageId}",
              "InstanceId": "${aws:InstanceId}",
              "InstanceType": "${aws:InstanceType}",
              "AutoScalingGroupName": "${aws:AutoScalingGroupName}"
            },
            "metrics_collected": {
              "mem": {
                "measurement": [
                  "mem_used_percent"
                ],
                "metrics_collection_interval": 60
              }
            },
            "aggregation_dimensions": [["AutoScalingGroupName"]]
          }
        }
Code language: YAML (yaml)
Set “append_dimensions” to the “AutoScalingGroupName” mentioned earlier.
Configure settings related to memory usage in “metrics_collected”. The usage metric name is “mem_used_percent”.
The key setting for the Auto Scaling group is “aggregation_dimensions”.
Specifies the dimensions that collected metrics are to be aggregated on. For example, if you roll up metrics on the AutoScalingGroupName dimension, the metrics from all instances in each Auto Scaling group are aggregated and can be viewed as a whole.
CloudWatch agent configuration file: Metrics section
By specifying the name of the Auto Scaling group, the behavior is to calculate memory usage based on the aggregate of multiple instances in the group.
Instance initialization by executing SSM documentation
Three types of SSM documents, predefined by AWS, are used to set up the instance.
AWS-ConfigureAWSPackage and AmazonCloudWatch-ManageAgent
Install and start the CloudWatch agent from the SSM document.
Basically, the setup is the same as on the aforementioned page.
The key point is how to specify the target instances, which are specified in the Targets property, but this time we will use the tags assigned to the instances; instances created in an Auto Scaling group will automatically be assigned the following tags
- Tag name: aws:autoscaling:groupName
- Value: [Auto Scaling group name].
When specifying a tag in the Targets property, it must be in the format “tag:[tag-name]”, so set the Key property to “tag:aws:autoscaling:groupName”.
By specifying the target instance using the automatically assigned tag in this way, this document will be automatically executed even for instances newly created in the Auto Scaling group.
AWS-RunShellScript
This is the configuration for running the instance as a web server.
Targets property is as described above, but other settings are the same as those described in the following pages.
VPC Endpoints
In this configuration, the Auto Scaling group is located in a private subnet, so it is necessary to access various services via VPC endpoints.
The following is a summary of the uses and corresponding endpoint service names.
Installation of CloudWatch Agent and Apache
Create an endpoint for S3 (com.amazonaws.${AWS::Region}.s3).
The instance to be created in this configuration is Amazon Linux 2, so it is possible to run yum against the repository built in the S3 bucket. Please refer to the following page for details.
SSM Document Execution
Create two endpoints.
- com.amazonaws.${AWS::Region}.ssm
- com.amazonaws.${AWS::Region}.ec2messages
If you want to access the created instance with SSM Session Manager, create an additional “com.amazonaws.${AWS::Region}.ssmmessages”.
Metrics delivery with CloudWatch Agent
Create two endpoints.
- com.amazonaws.${AWS::Region}.monitoring
- com.amazonaws.${AWS::Region}.ec2
If you want the CloudWatch agent to deliver logs as well, create an additional “com.amazonaws.${AWS::Region}.logs”.
Architecting
Use CloudFormation to build this environment and check actual behavior.
Create CloudFormation stacks and check resources in stacks
Create a CloudFormation stack.
For information on how to create stacks and check each stack, please refer to the following page
After checking the resources in each stack, the following is the information on the main resources created in this case.
- DNS name of ALB: fa-030-ALB-833774591.ap-northeast-1.elb.amazonaws.com
- Target group: fa-030-ALBTargetGroup
The AWS Management Console also checks the status of resource creation. First, check the Auto Scaling group.
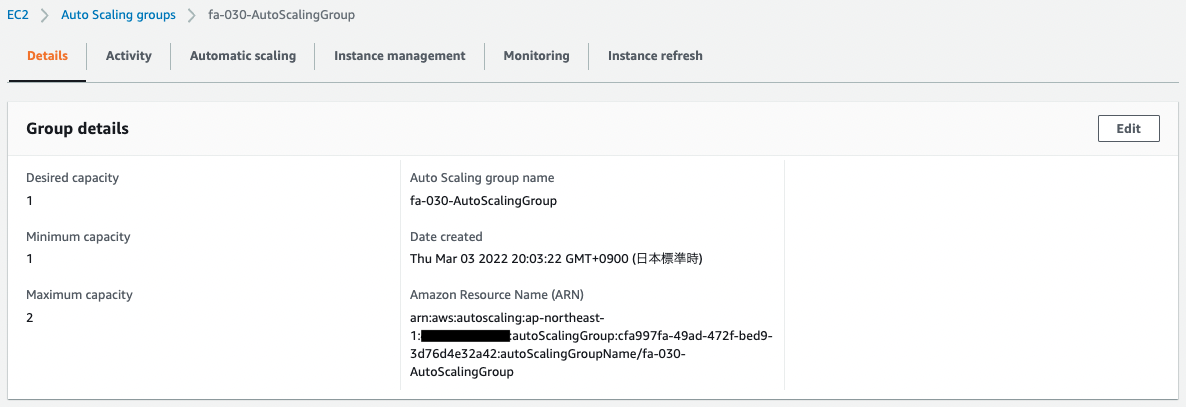
You can see that the Auto Scaling group has been successfully created.
Check the scaling policy of this Auto Scaling group.
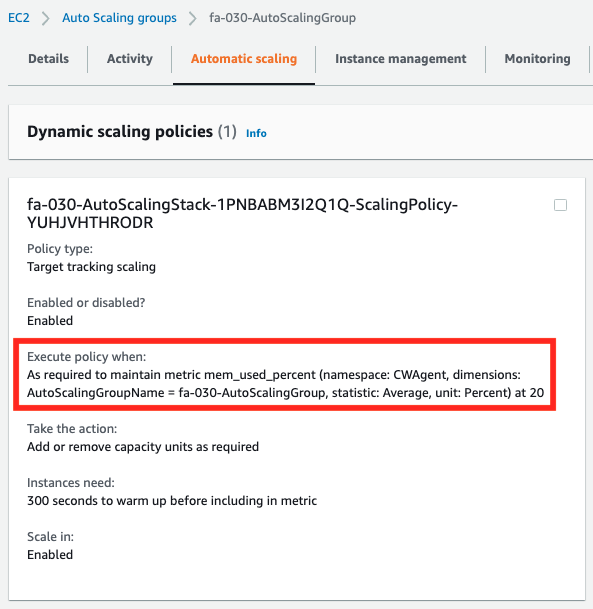
You can confirm that scaling is based on memory utilization.
Check the status of instances in the Auto Scaling group.
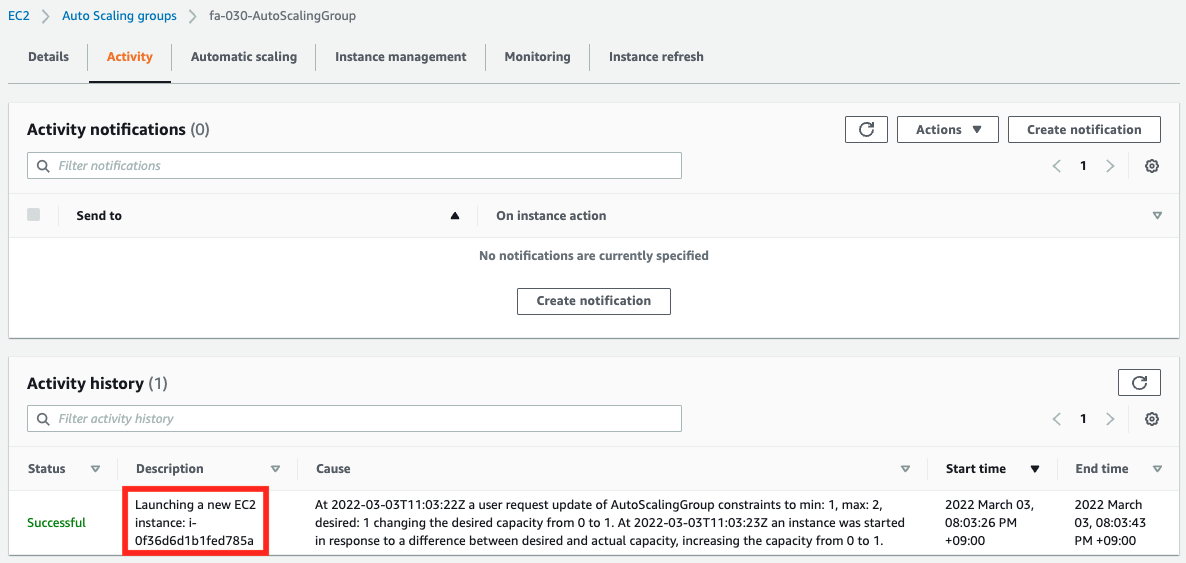
Activity history shows that one instance was created as per the desired number.
Operation check 1
Now that everything is ready, access the ALB.
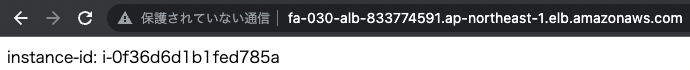
We received a response from an instance in the Auto Scaling group.
Scaling Confirmation
The CloudWatch metrics page shows that the memory utilization of the instance is above the scaling threshold (20%).
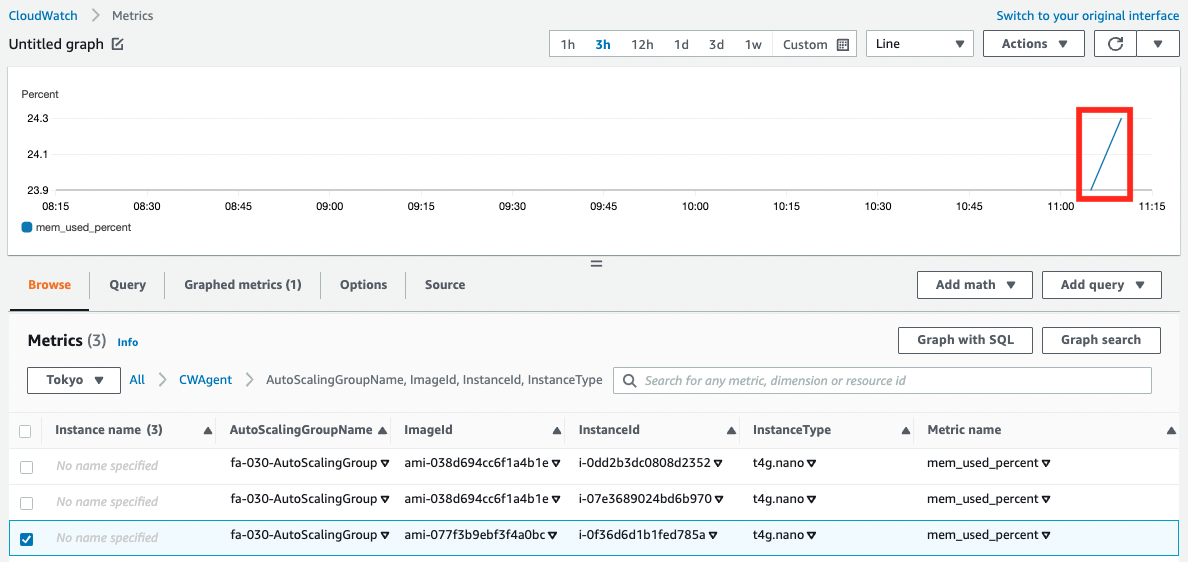
Scaling is initiated.
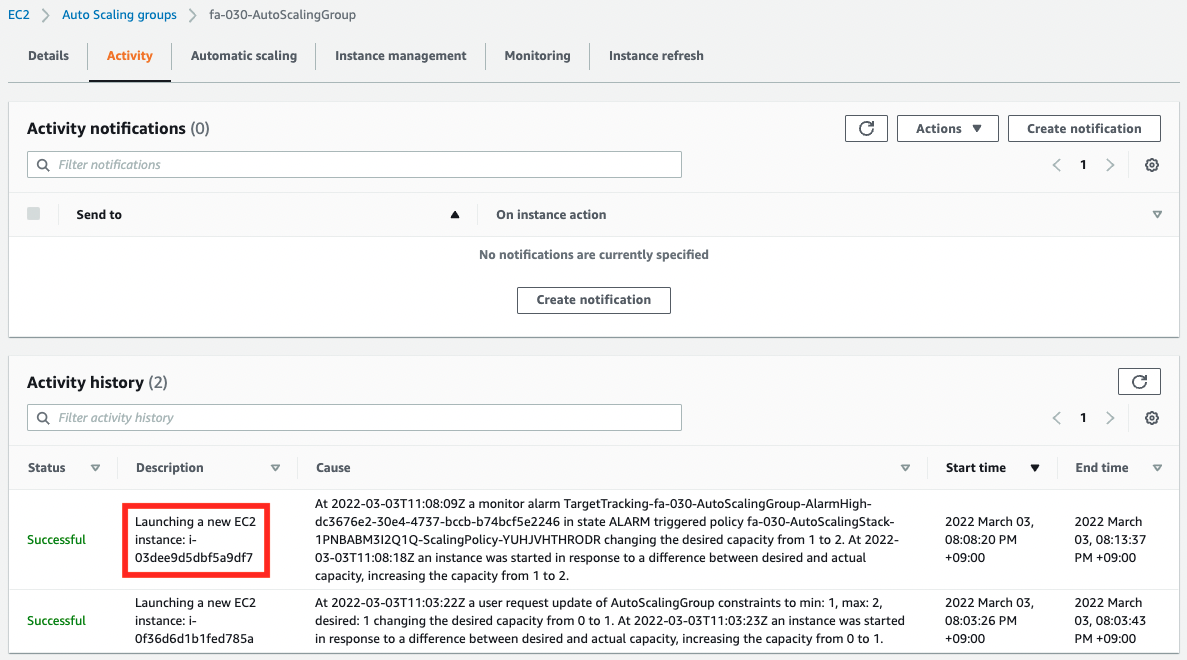
After a short wait, scaling is completed and a new instance is created.
Operation check 2
Access the ALB again.
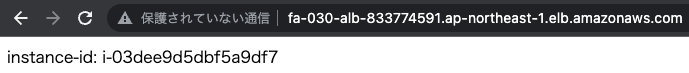
We were able to access a new instance in addition to the previous one. Indeed, scaling was performed based on memory utilization.
Summary
We have installed CloudWatch Agent on an EC2 instance (Amazon Linux 2) and confirmed the configuration to scale based on custom metrics (memory utilization).